Data Insights
Animal Crossing: Canada Wildlife Collision Risk in Commercial Fleets
April 21, 2026
Head of Insights

Get the latest from Samsara
Subscribe nowOverview
On long stretches of Canadian highway, the road can feel empty. Forest lines the roadside for miles, mountains rise in the distance, and the nearest town may be hours away. But those same roads run through some of the most active wildlife habitat in North America—and for commercial fleets, that overlap creates one of the most unpredictable risks on the road.
To better understand how often these incidents occur—and when the risk is highest—Samsara analyzed wildlife-related crashes recorded across commercial fleets between February 2022 and July 2025. The analysis examined crash timing, geography, road type, and time of day to identify the conditions most associated with wildlife collisions.
The data shows a clear seasonal pattern: wildlife collisions build through the spring, peak in late spring and early summer, and rise again in late fall.
Wildlife collision risk doubles in late spring
Wildlife collisions involving commercial fleets follow a distinct seasonal rhythm. Early in the year, incidents are distributed relatively evenly across months. But beginning in late spring, the pattern changes sharply. May and June together account for roughly 29% of all wildlife collisions, making them the most concentrated period of risk for fleets operating on Canada's rural highways.
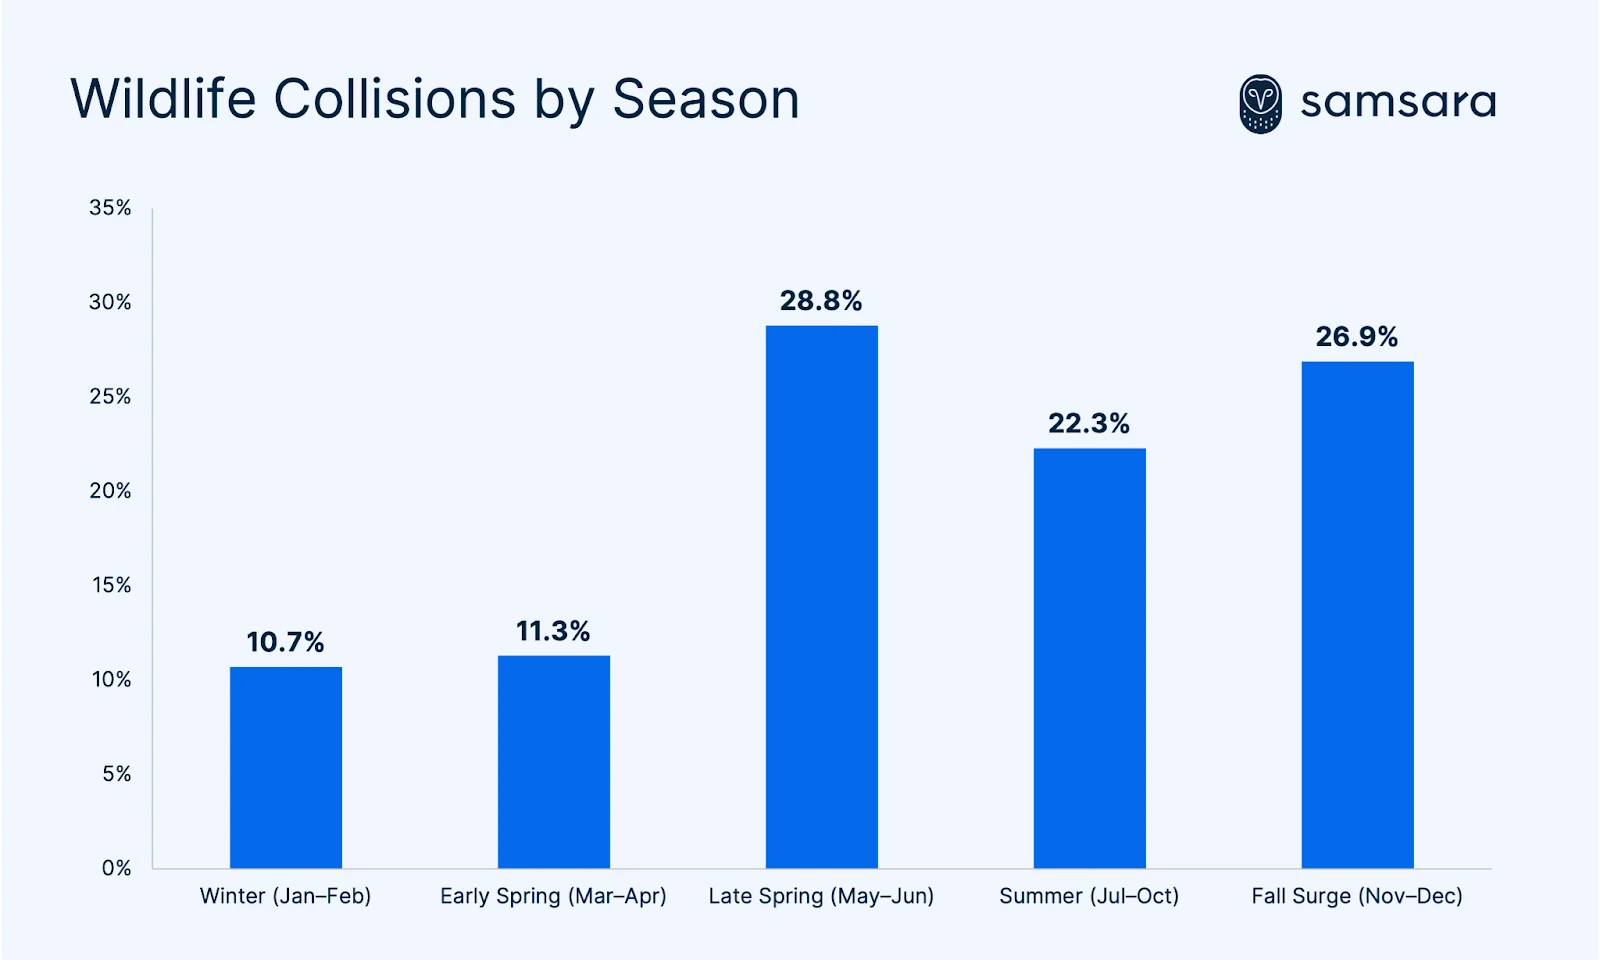
The spring spike becomes even clearer when comparing those months with the winter baseline. Wildlife collisions are roughly 2.7x more likely in May–June than during the January–February period.
November and December also show a notable secondary peak—driven by ungulate rut season and rapidly declining daylight hours—before activity subsides through winter.
Period | Avg. Share of Wildlife Collisions |
|---|---|
Winter baseline (Jan–Feb) | 10.7% |
Spring build (Mar–Apr) | 11.3% |
Spring peak (May–Jun) | 28.8% |
Fall surge (Nov–Dec) | 26.9% |
Most wildlife collisions occur between dusk and dawn
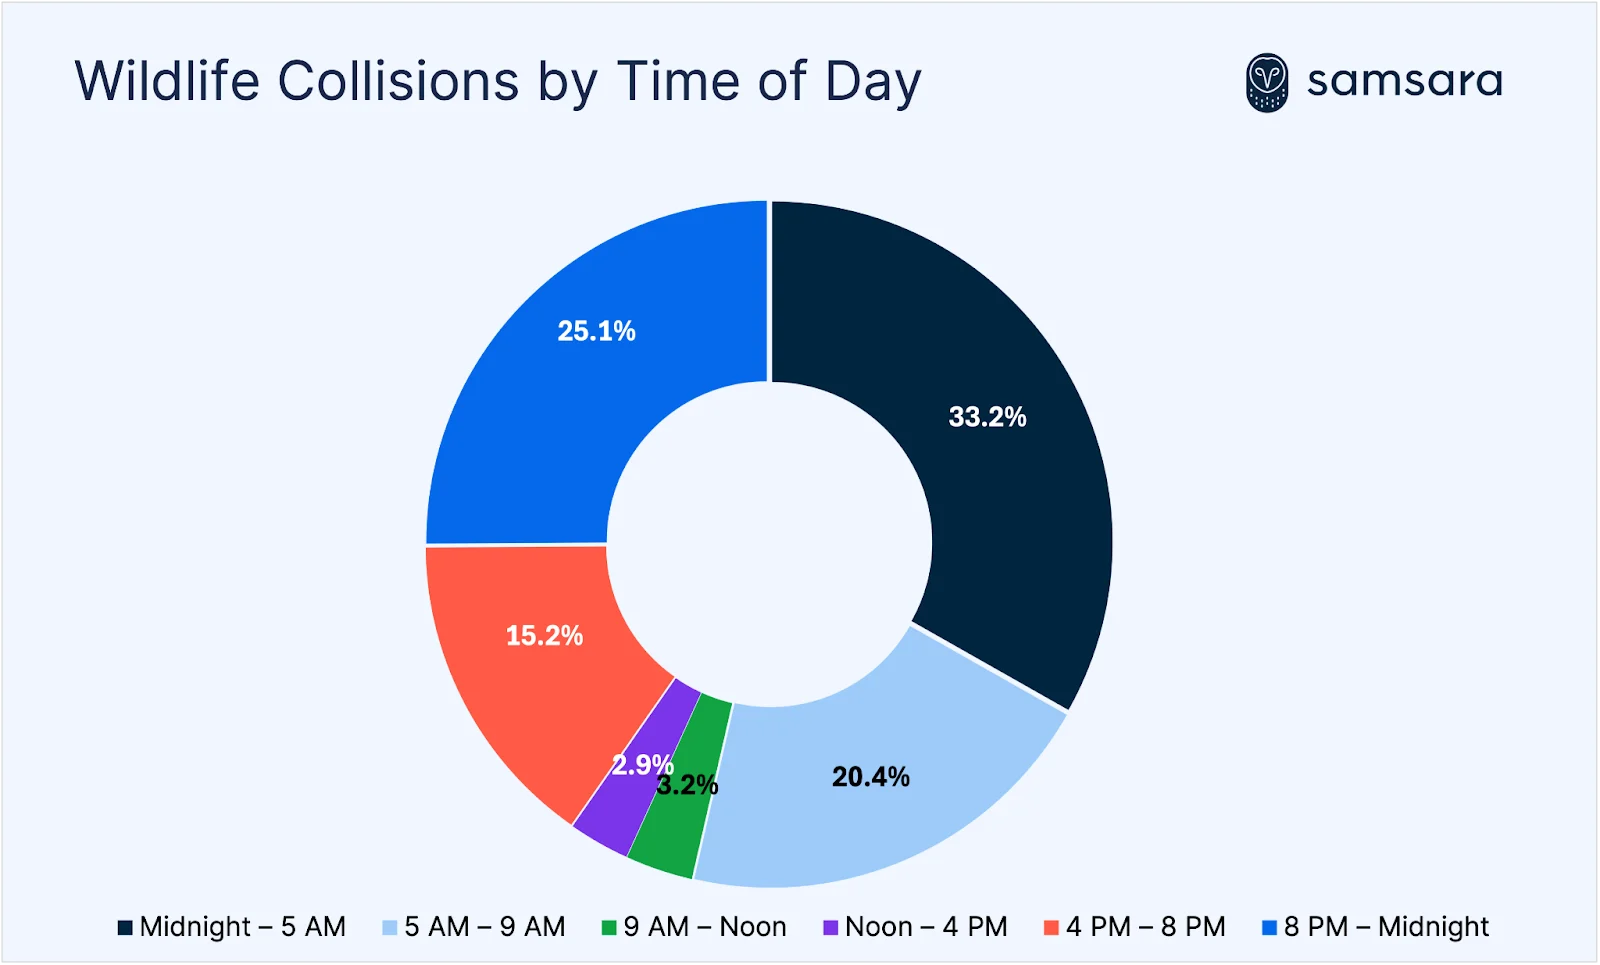
Seasonality explains when during the year wildlife collisions increase. But examining the time of day reveals an equally striking pattern: nearly four out of five wildlife collisions occur during darkness, between 8 PM and 9 AM local time.
Time of Day (Local) | Avg. Share of Wildlife Collisions |
|---|---|
Midnight – 5 AM | 33.2% |
5 AM – 9 AM | 20.4% |
9 AM – Noon | 3.2% |
Noon – 4 PM | 2.9% |
4 PM – 8 PM | 15.2% |
8 PM – Midnight | 25.1% |
Crash timestamps were recorded in UTC and have been converted to local time using each crash location's provincial time zone, including daylight saving time adjustments where applicable.
Many large mammals—deer, moose, and elk—are crepuscular: most active during the transitions around dawn and dusk. The data confirms this. The overnight window from 8 PM to 5 AM accounts for 58% of all wildlife collisions, with a secondary peak during the dawn hours of 5–9 AM. Together, the full darkness-to-dawn window (8 PM – 9 AM) accounts for approximately 79% of incidents.
During full daylight—9 AM to 4 PM—wildlife collisions nearly vanish, accounting for just 6% of the total. Risk then climbs again in the late afternoon as daylight fades, with the 4–8 PM dusk window contributing 15% of collisions before the overnight peak resumes.
For fleets operating overnight routes through rural wildlife corridors, these hours represent the highest-risk window—not because of weather or road conditions, but because darkness and peak animal activity overlap. The 94% clear-conditions finding (see below) reinforces this: the danger is not reduced visibility from storms, but the fundamental coincidence of active wildlife and limited sightlines after dark.
Collisions concentrate along freight highways
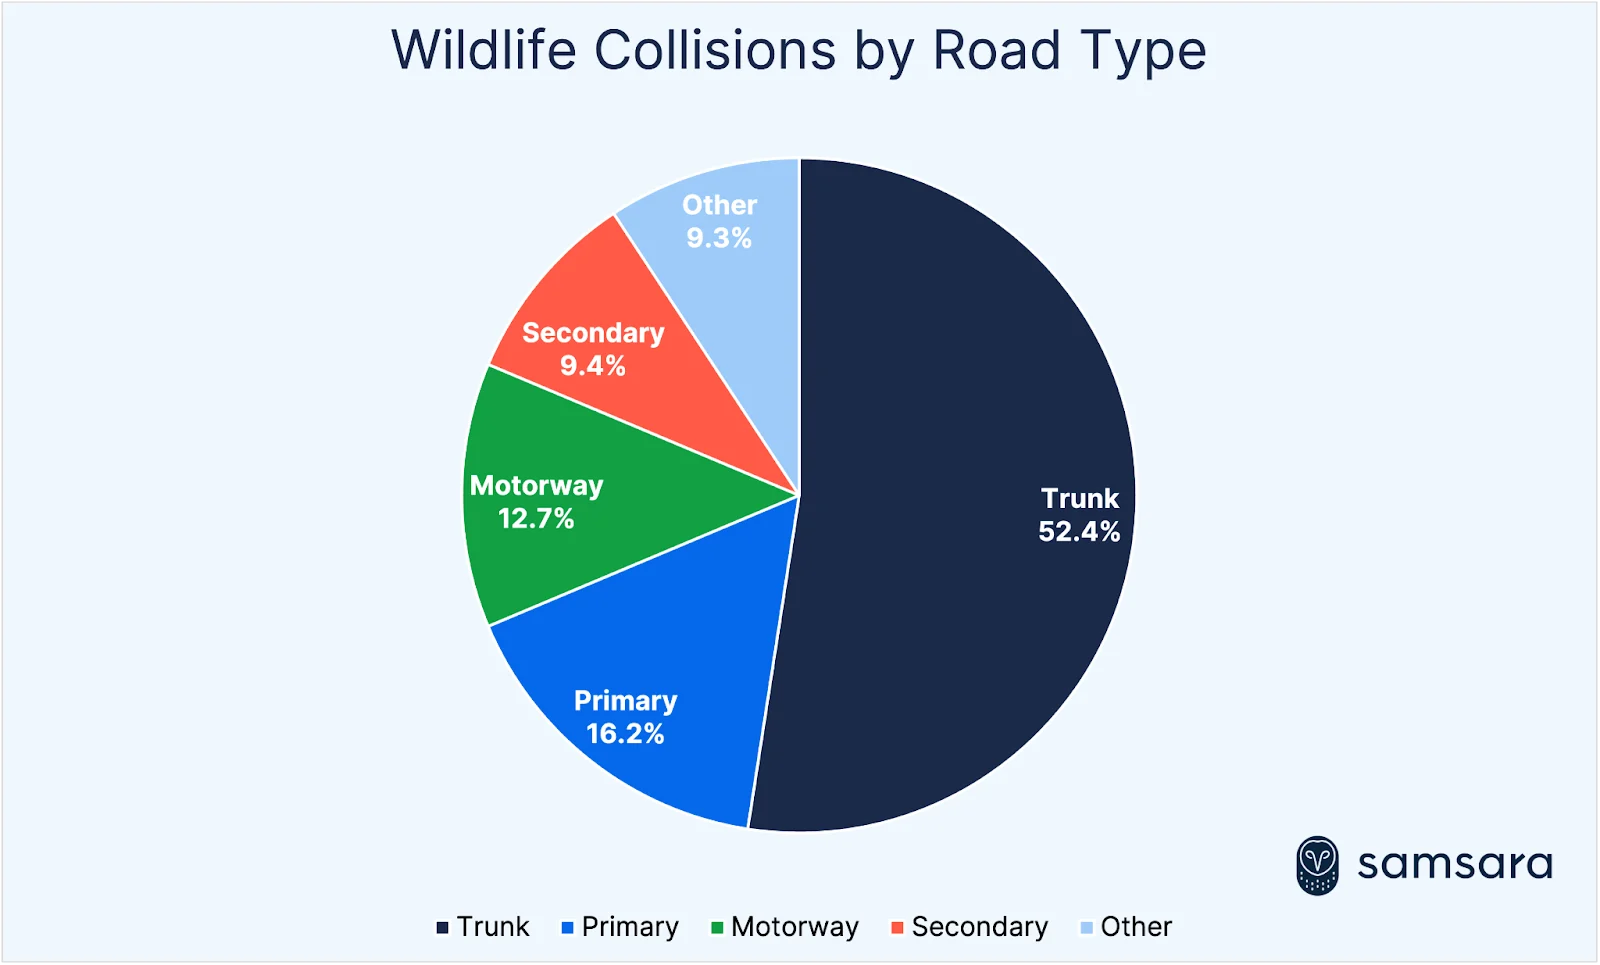
Wildlife collisions involving commercial fleets occur primarily on major highways rather than smaller local roads.
Road Type | Avg. Share of Wildlife Collisions |
|---|---|
Trunk highways | 52.4% |
Primary highways | 16.2% |
Motorways | 12.7% |
Secondary roads | 9.4% |
Other | 9.3% |
More than 8 out of 10 wildlife collisions occur on major intercity highways, where long-distance freight traffic is most concentrated.
Trunk highways are major, paved, and usually high-speed roadways connecting cities and regions. Unlike motorways, they typically lack controlled access, median barriers, and wildlife exclusion fencing—meaning animals can enter the roadway at virtually any point. This makes trunk highways the most common setting for animal collisions despite motorways carrying comparable or greater traffic volumes.
Where wildlife collisions cluster
Wildlife collisions concentrate on a small set of highway corridors. The top 10 roads alone account for over half of all wildlife collisions recorded:
Rank | Road | Share | Dark-Hours | Province(s) |
|---|---|---|---|---|
1 | Trans-Canada Highway | 10.8% | 88% | MB, SK, AB, BC, NL |
2 | Yellowhead Highway | 7.5% | 84% | AB, BC |
3 | Highway 11 | 7.3% | 88% | ON |
4 | Highway 17 | 6.9% | 84% | ON |
5 | Highway 2 | 6.0% | 89% | AB |
6 | Highway 43 | 4.7% | 68% | AB |
7 | Crowsnest Highway | 3.9% | 83% | BC, AB |
8 | Alaska Highway | 2.4% | 91% | BC, YT |
9 | Bighorn Highway | 2.2% | 80% | AB |
10 | Highway 63 | 1.7% | 62% | AB |
Dark-Hours = share of collisions occurring between 8 PM and 9 AM local time.
These corridors share common traits: they are trunk highways—high-speed, two-lane roads without controlled access or wildlife exclusion fencing—passing through boreal forest, parkland transition zones, or mountain passes. The municipalities where collisions recur most—Reynolds (MB), Thunder Bay District (ON), Yellowhead County (AB), MD of Greenview (AB)—sit along the most isolated stretches of these routes, where sightlines are limited and wildlife crossings are frequent.
Darkness compounds the risk. Nine of the top 10 corridors see 80% or more of their wildlife collisions during dark hours, with Alaska Highway (91%) and Highway 2 (89%) among the highest. Highway 63—the Fort McMurray corridor—is the exception at 62%, likely reflecting the mix of daytime oilsands traffic on that route. The long, unlit stretches of Highway 17 and Highway 11 through Northern Ontario's dense boreal forest—connecting Thunder Bay, Cochrane, Kenora, and Algoma districts—create conditions where moose encounters are both frequent and difficult to avoid.
Each province has its own collision season
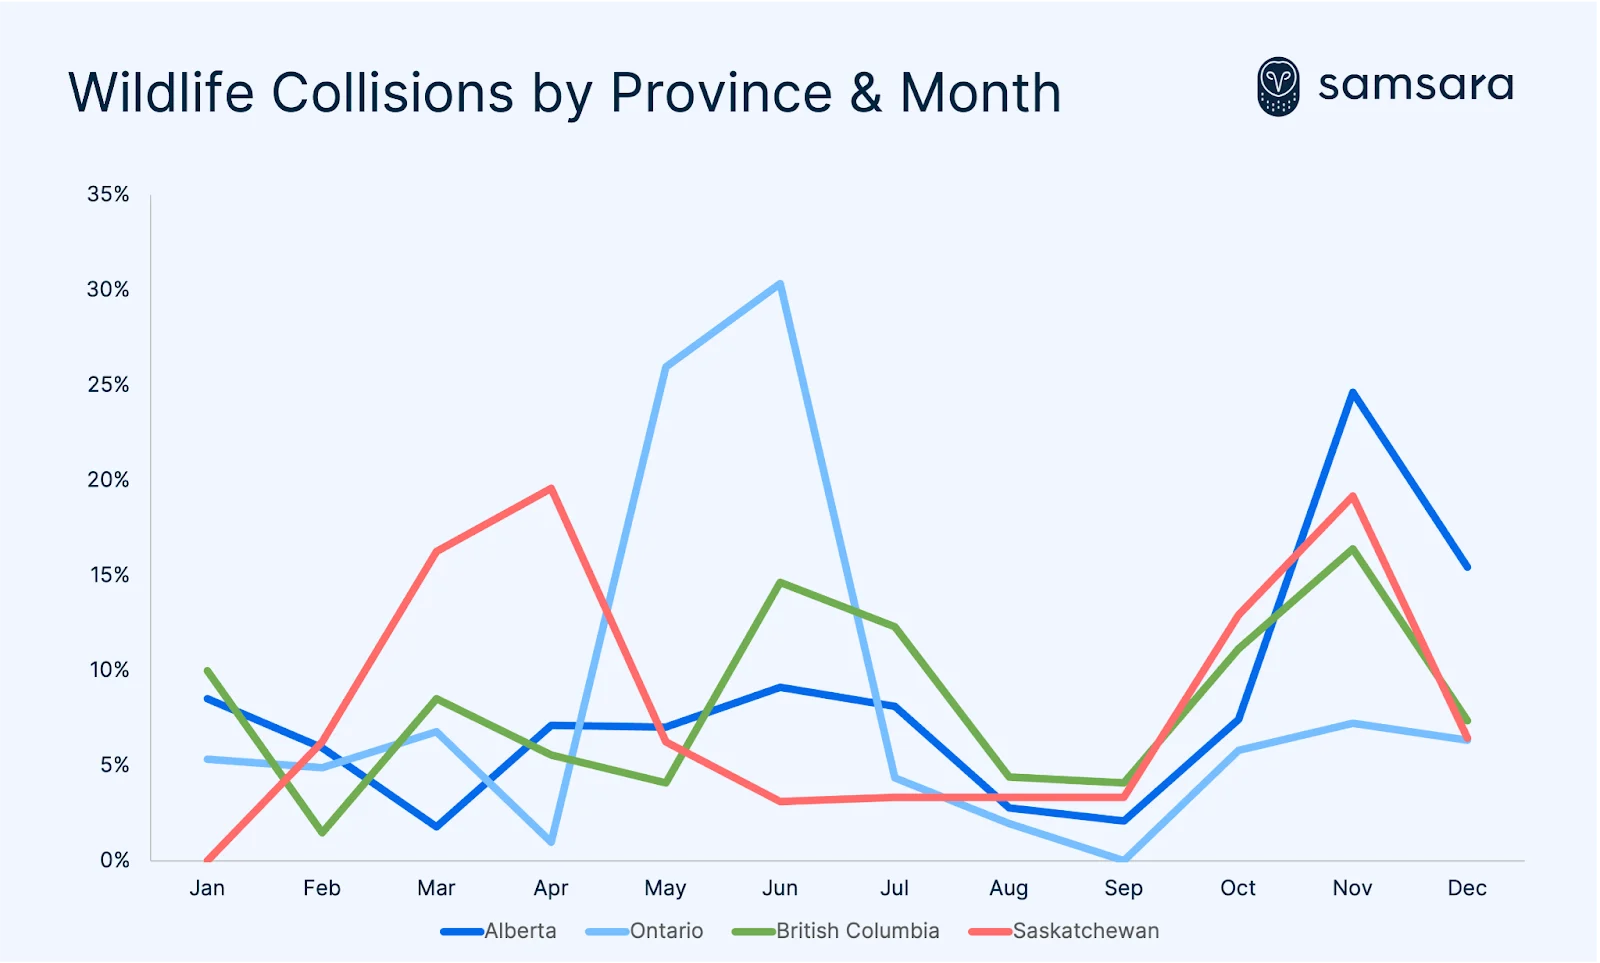
Province | Peak Collision Months | Seasonal Pattern |
|---|---|---|
Alberta | November–December | Late fall/early winter dominant |
Ontario | May–June | Spring dominant |
British Columbia | October–December | Fall dominant |
Saskatchewan | March–April | Early spring dominant |
This means that a fleet operating primarily in Alberta faces a different risk calendar than one running routes through Northern Ontario. Understanding the local collision season—not just the national average—is critical for timing driver alerts, adjusting speed guidance, and prioritizing route monitoring.
Mid-week and end-of-week carry the highest collision risk
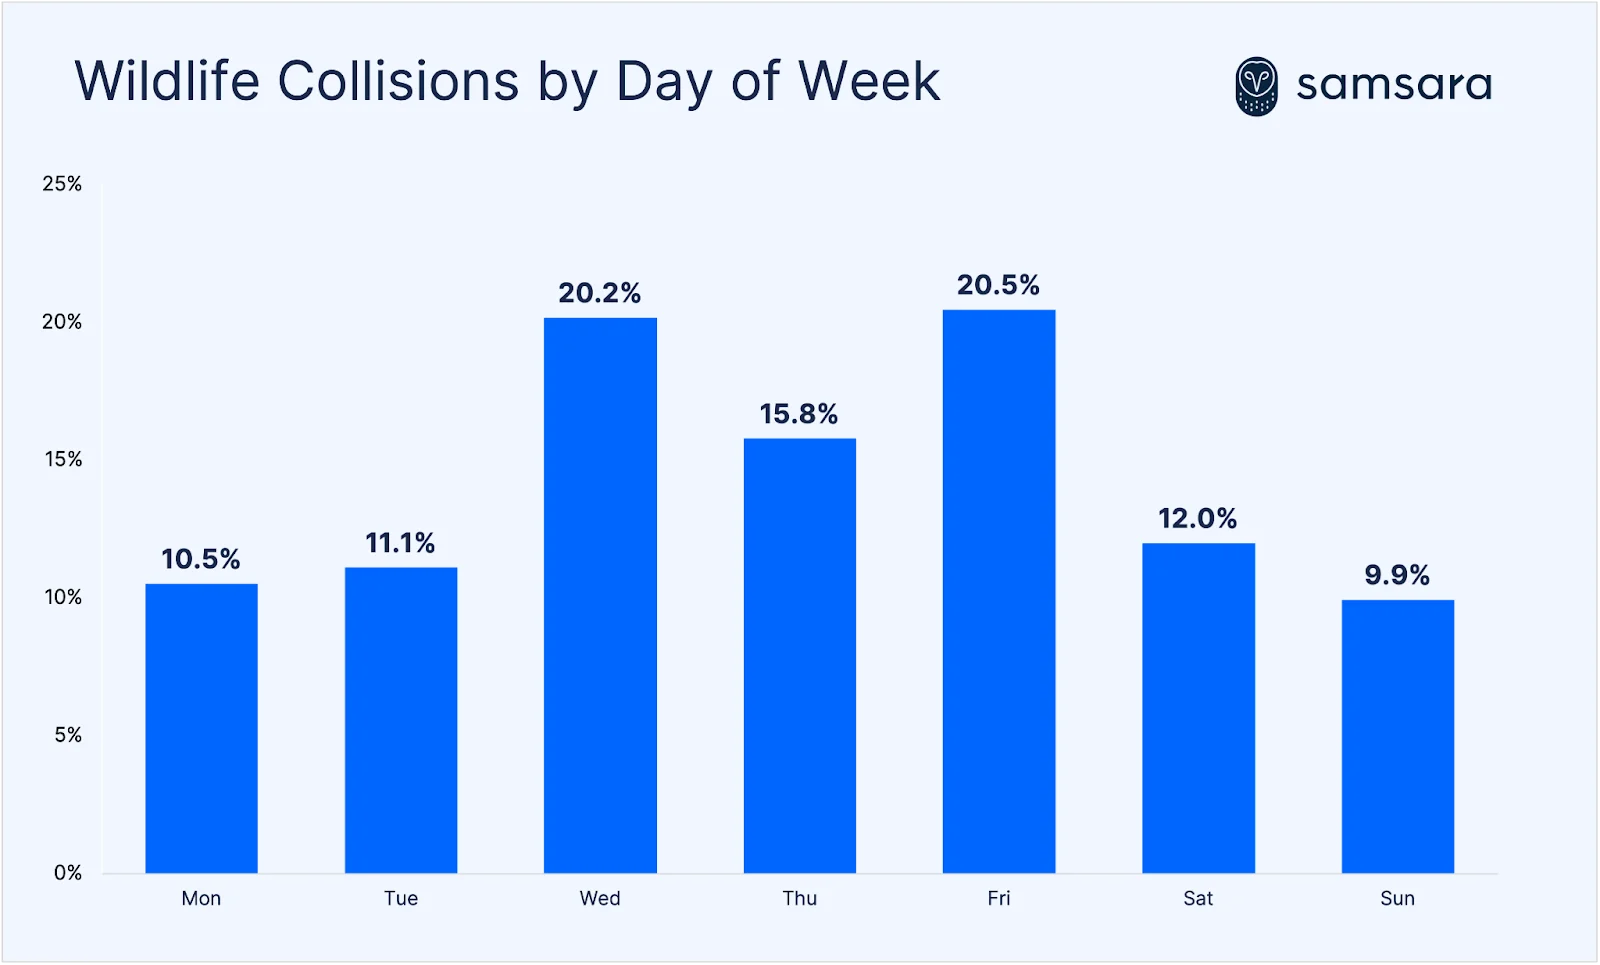
Long-haul truck volumes peak midweek—Tuesday through Thursday—as loads dispatched early in the week reach their furthest rural corridors. By Friday, end-of-week scheduling pushes a second wave of traffic onto those same highways during late afternoon and overnight, precisely when wildlife activity is highest.
Day of Week | Avg. Share of Wildlife Collisions |
|---|---|
Monday | 10.5% |
Tuesday | 11.1% |
Wednesday | 20.2% |
Thursday | 15.8% |
Friday | 20.5% |
Saturday | 12.0% |
Sunday | 9.9% |
The pattern aligns with how commercial freight actually moves. Long-haul truck volumes peak midweek—Tuesday through Thursday—as loads dispatched early in the week reach their furthest rural corridors. By Friday, end-of-week scheduling pushes a second wave of traffic onto those same highways during late afternoon and overnight, precisely when wildlife activity is highest.
For fleets, the practical implication is clear: wildlife collision exposure is meaningfully elevated across the middle and end of the operating week, not concentrated on any single day.
Wildlife collisions happen in clear conditions
An intuitive assumption might be that bad weather—snow, ice, rain—increases wildlife collision risk by reducing driver visibility and vehicle control. The data tells a different story.
Surface Conditions | Share of Wildlife Collisions |
|---|---|
Clear / dry | 94.0% |
Snow or ice visible | 3.0% |
Rain / wet road | 1.0% |
Snowing / ice on road | 1.0% |
Approximately 94% of wildlife collisions occur in clear, dry conditions. This finding reinforces that the primary risk driver is wildlife behaviour and timing—not weather. Animals cross roads because of seasonal movement patterns, not because drivers can't see them in the rain. It also means that fleets cannot rely on weather forecasts to anticipate wildlife collision risk. The danger exists on calm, clear nights just as much as during storms—arguably more so, since clear conditions coincide with higher average speeds.
What fleets should watch for this spring
Taken together, the data shows that wildlife collisions are not random events. They follow a predictable pattern shaped by season, geography, time of day, and even day of week.
For fleets operating across Canada's rural highway network, the highest-risk profile combines several factors:
Late spring months (May–June), when wildlife movement increases sharply—accounting for roughly 2.7x the collision rate of winter months. In Alberta, the risk window extends into November–December.
Low-light driving conditions, particularly late at night and early morning—periods that account for 58% of all wildlife collisions. This holds true in clear weather: 94% of incidents occur on dry roads.
Specific corridor hotspots—the Yellowhead Highway, Highway 43, and Highway 11/17—where crash density, dark-hours concentration, and wildlife habitat overlap create persistent, localized danger zones.
Friday and end-of-week scheduling, when freight traffic on rural corridors peaks and overlaps with the highest-risk evening and overnight hours.
When those factors overlap, the likelihood of encountering wildlife on the road rises significantly. The pattern is consistent enough that fleets can anticipate it—adjusting speed guidance on high-risk corridors, timing driver alerts to provincial collision seasons, and monitoring the specific highway segments where incidents concentrate year after year.
Wildlife collisions will never be fully preventable on Canada's vast rural highway network. But understanding the where, when, and how of these incidents—down to the specific corridor, time of day, and week of year—transforms an unpredictable hazard into a manageable, anticipatable risk.
A note on methodology: Monthly shares represent the average distribution of wildlife collisions across the dataset, calculated by measuring the share of incidents within each year and then averaging. This approach prevents any single year's volume from distorting the seasonal pattern.
Get the latest from Samsara
Subscribe nowRead more


– 7 min read
Samsara Drives Cost-Savings Opportunities for Customers in their First Year

Manager, Expansion Growth

AI reveals where and when American drivers are most distracted

Senior Data Scientist

Canada’s two seasons: Winter and construction

Head of Insights