Belonging at Samsara


Our Ongoing Commitment


Attraction


Development & Retention


Oversight & Accountability
Attraction
Creating an inclusive hiring process
Samsara aims to attract and hire top-level talent with a wide range of skill sets and experience. With a diverse group of talented people, we create better solutions to increase the safety, efficiency, and sustainability of the world’s physical operations. It’s not just good for business, it’s the right thing to do. Inclusive recruiting ensures diversity is more than a buzzword by deeply embedding objective, equitable, and inclusive behaviors throughout the recruiting lifecycle. It means engaging in partnerships and events, prioritizing talent pipelining, ensuring our job postings are inclusive, providing education and relevant data, and driving accountability at all levels.
Broadening our top-of-funnel:
We are taking proactive steps to increase diverse representation by attracting and hiring talent at every level through partnerships and collaboration with a number of different job boards, a wide range of universities, and volunteer event participation. In addition, we are intentional about outreach through source channels that include diverse representation.
This past year, Samsara participated in the Atlanta University Center Consortium Career Fair, representing four historically Black colleges and universities (HBCUs), with 60 students from various majors. We also participated in our first military career fair, Military MOJO, and our R&D and Inclusion & Belonging teams attended the 2023 Grace Hopper Celebration.
Through our Project SEED (Source, Engage, Evaluate, Drive) approach, we’ve prioritized executive talent pipelining, proactively identifying potential future executive leaders to build and nurture relationships with over time.
Development & Retention
Accelerating innovation through representation and inclusion
It’s not enough to attract globally diverse talent. We have to ensure that individuals transitioning from candidate to employee feel welcome and connected and have the opportunity to excel professionally. We continue to invest in enterprise-wide programs, professional and leadership development, and employee-driven groups to help ensure that members of underrepresented communities feel our support and know their sense of belonging is a priority.
Fostering an Inclusive Culture
We launched a Women’s Leadership Program (WLP) for our employees in our R&D department this year. This program, focused on retention and development, is designed to build a sense of community, foster collaboration, increase self-realization, and offer tangible, practical skills for the workplace.
Owl Connected, our company-wide mentorship program, launched late last year, giving participants opportunities to own their development, expand their network, promote career development, learn new skills, and support each other through shared experiences and meaningful relationships. We have 32% of Samsarians registered as either a mentor or mentee, with 52% of registrants engaged in active pairings, and ~1400 mentoring sessions completed.
We support and encourage participation in seven active Employee Resource Groups (ERG) across the company, along with multiple shared-interest communities.
Oversight & Accountability
Raising our bar
Ongoing, we propose, review, and revise policies and goals to ensure fairness of process in all departments, initiatives, and activities.
Source, engage, and hire the best talent from schools, networks, and industries where diverse talent is. An aggressive and strategic approach will yield tremendous results.
Ensure fairness and objectivity in our performance review process by equipping managers and leaders with the right tools, implementing structured calibration sessions, and leveraging data-driven validations—creating a transparent and equitable environment where everyone’s contributions are recognized
Continue to create awareness and education opportunities for our leadership team to understand that intentionality in inclusivity leads to increased innovation, better business outcomes, and increased workplace effectiveness. This level of awareness will enable our leaders to turn good intentions into reality and equip leaders to explore the impact diversity has on perspectives, assumptions, and approaches and identify ways to prioritize change and measure progress.
By the Numbers
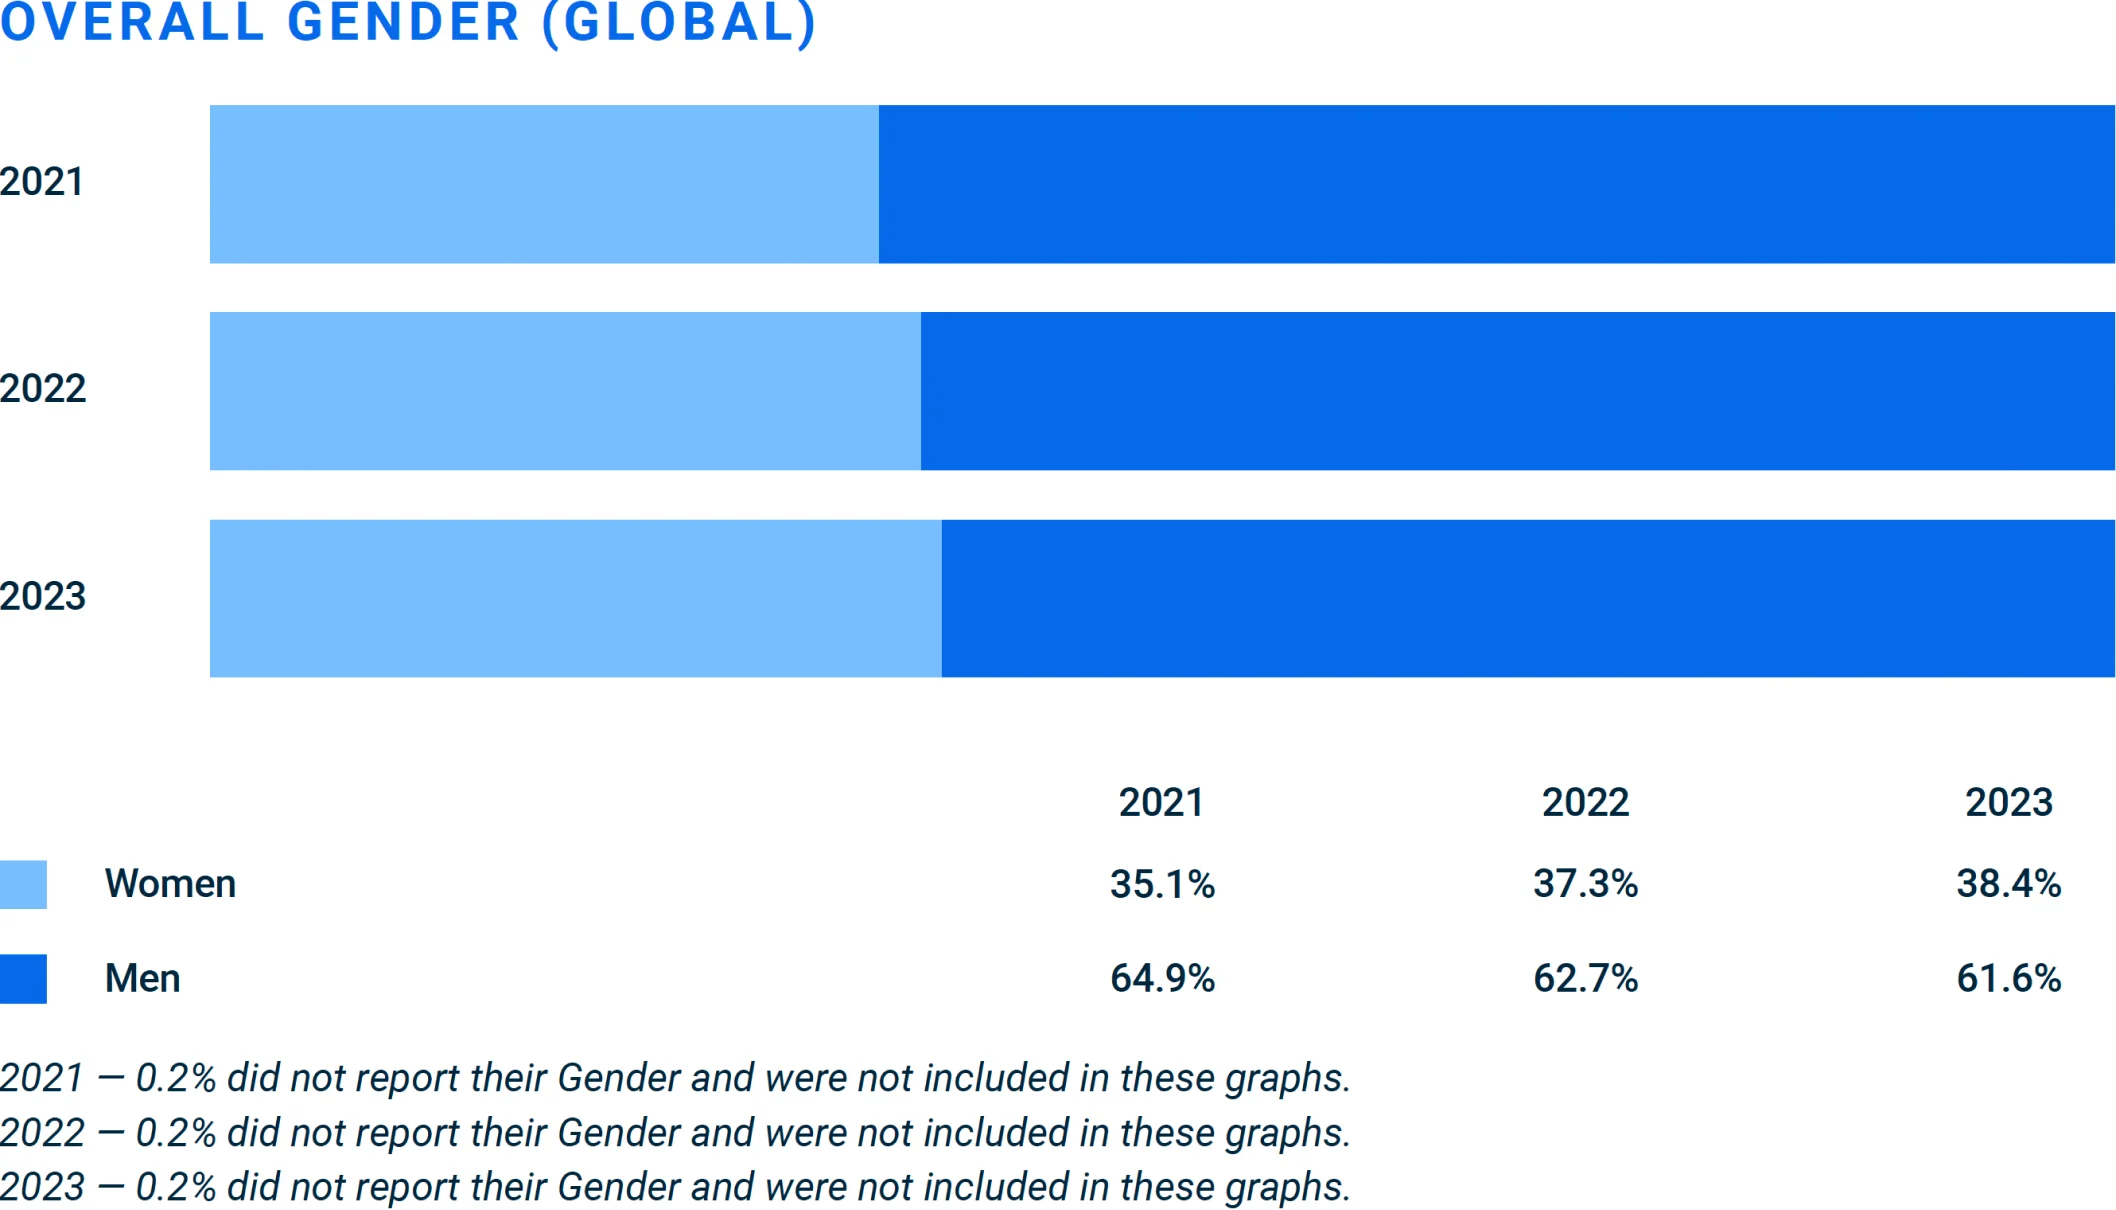
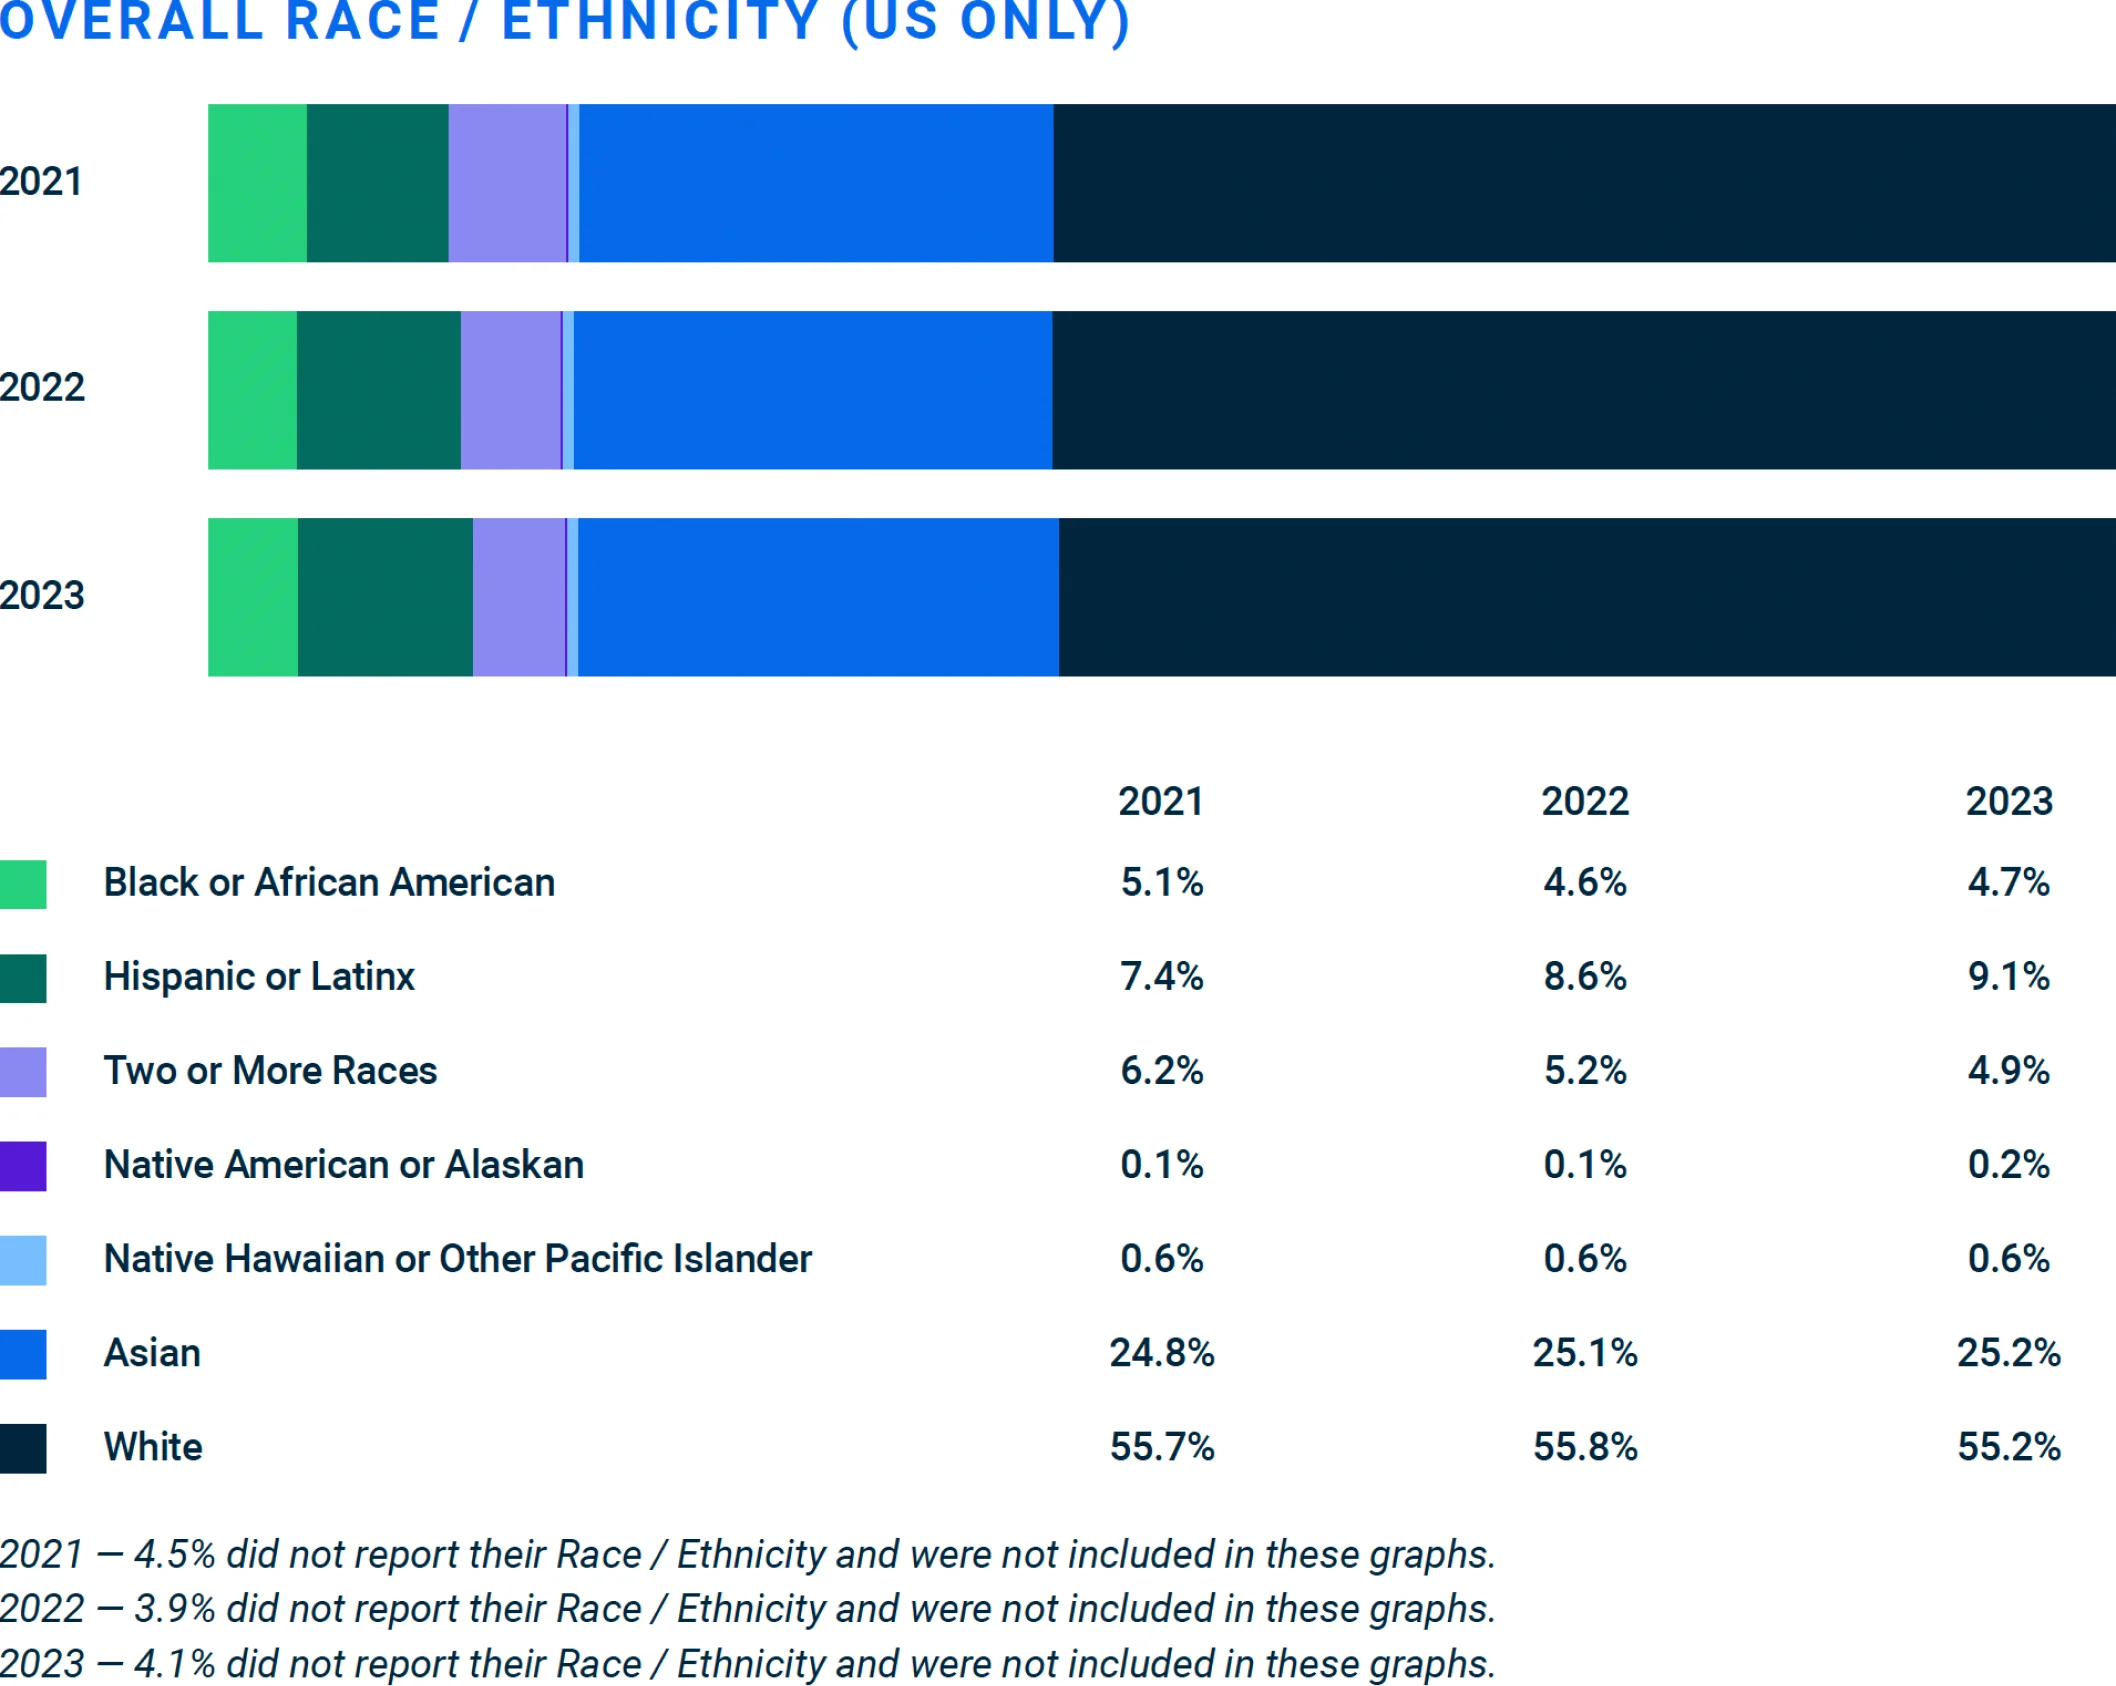
At Samsara, we depend on the unique approaches of our team members to help us solve complex problems. We are committed to ensuring that Samsara is a place where people from all backgrounds can make an impact.
Company Overall
“Overall” refers to current Samsarians, excluding employees who did not report the relevant data.
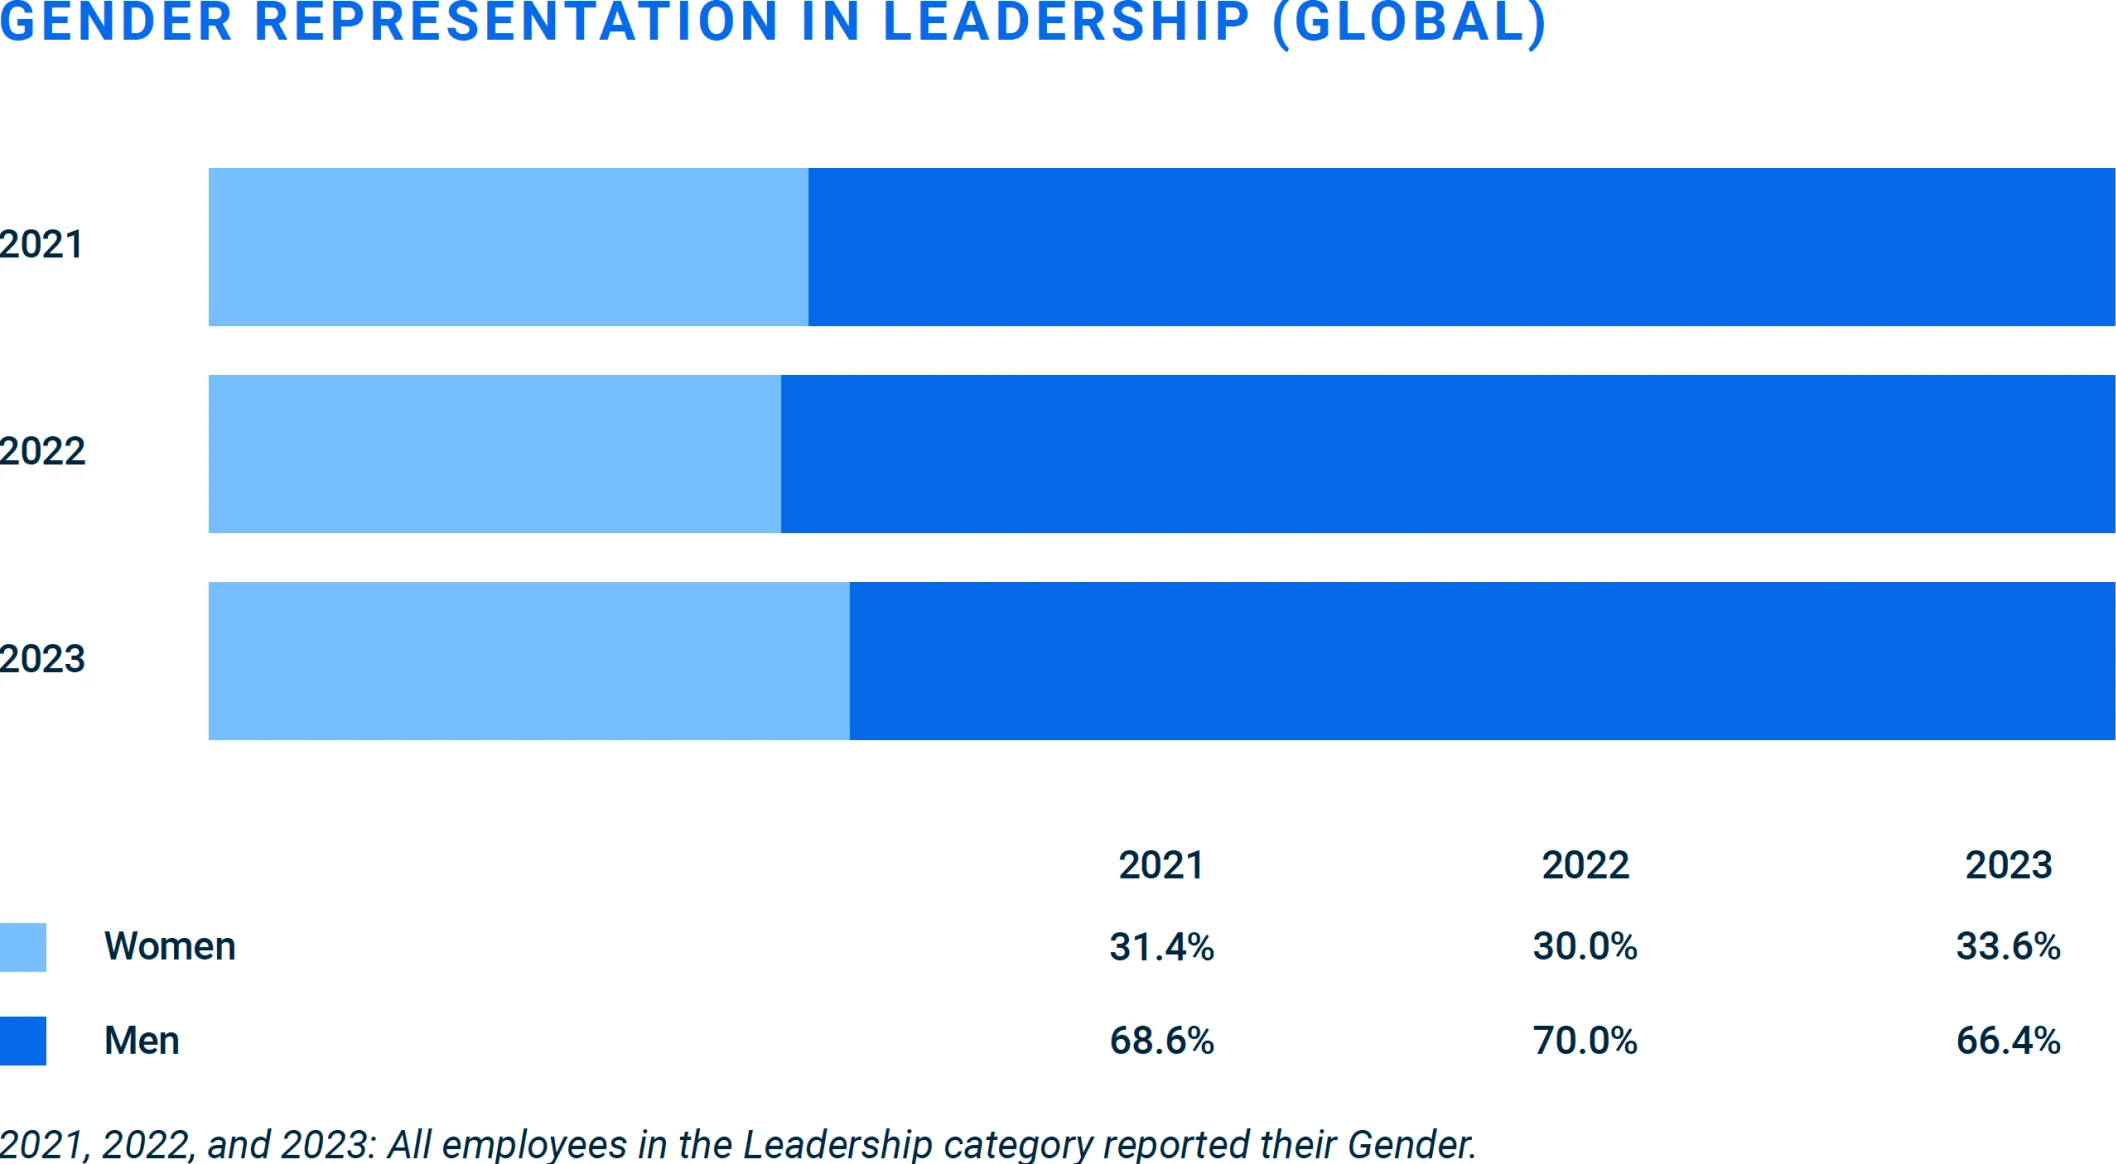
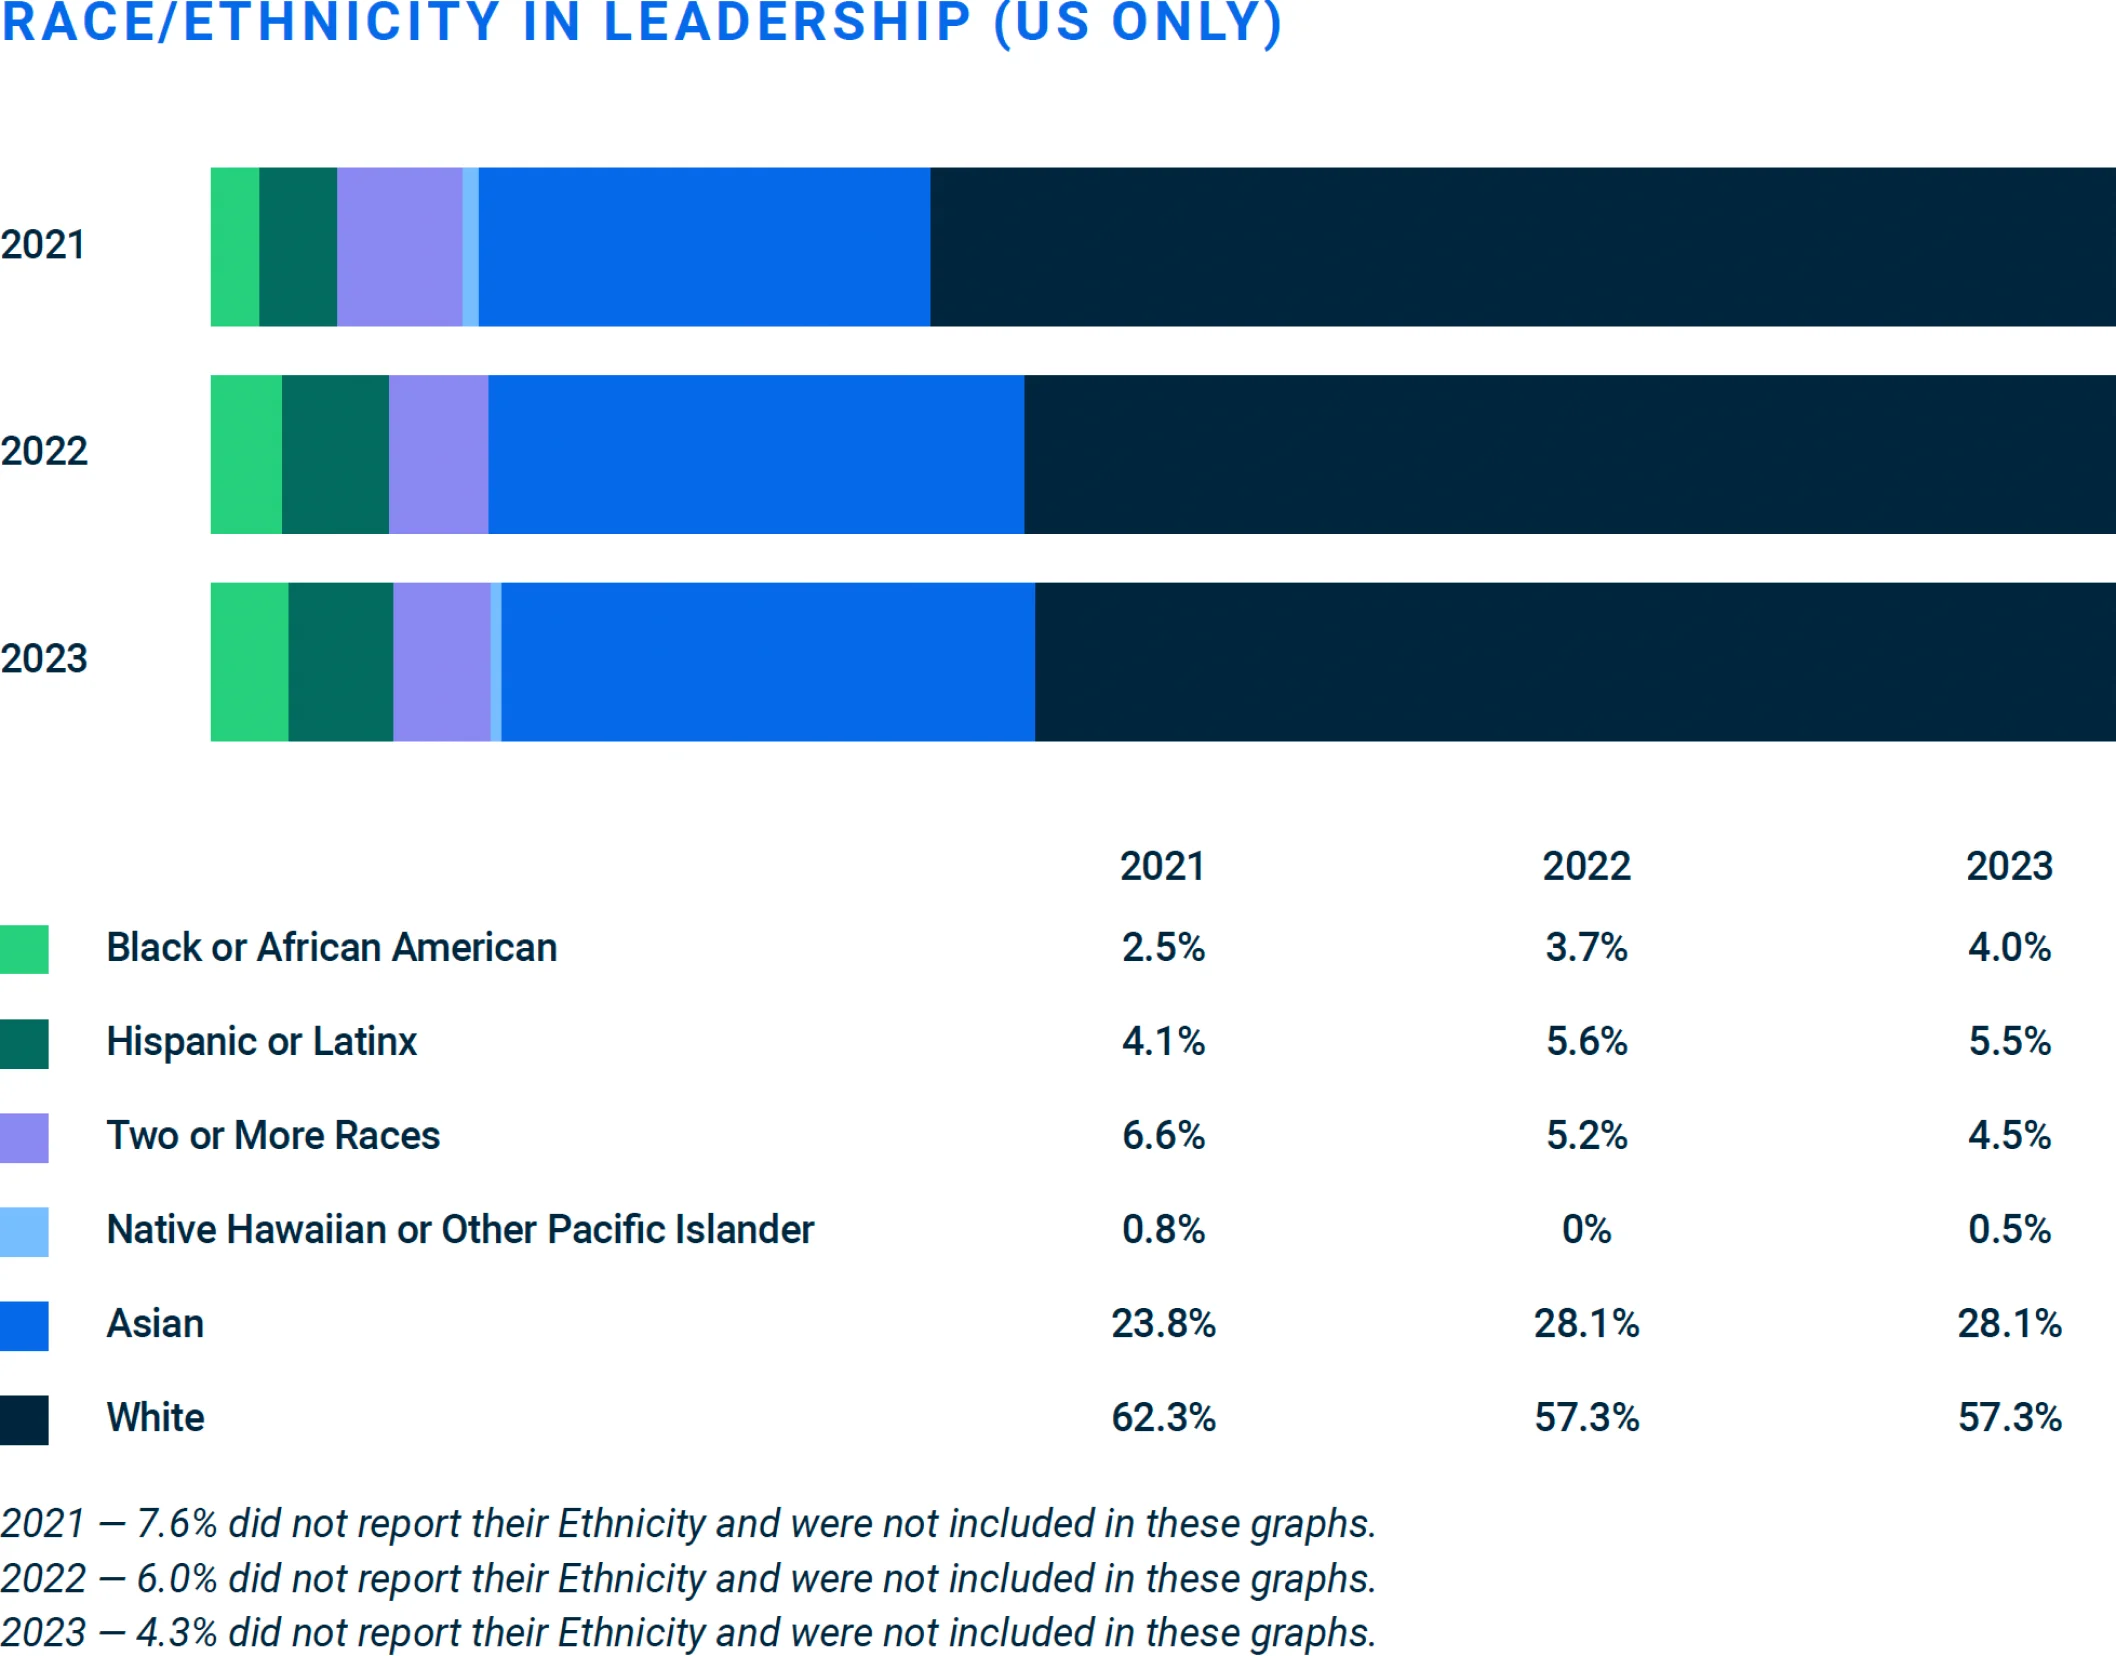
Leadership Roles
“Leadership” refers to Samsarians who are at the director and above level.
COMMUNITY AND DIVERSITY
Samsara’s Employee Resource Groups


Blaccsara

Latinxs at Samsara

Pride at Samsara

Women of Samsara
We foster a culture of mentorship and allyship, creating inclusive spaces where all women and their allies can learn from and uplift one another.
As Women of Samsara, we champion women’s personal and professional growth, enable meaningful networking, nurture collaboration, and drive community and customer connection. Founded in 2017 as Samsara's first ERG.

Veterans at Samsara

AAPI at Samsara
Our goal is to build an inclusive and dynamic space where community members and allies can engage in a variety of activities, such as networking and social support, advocacy and action, and education and resource sharing. Founded in 2021.

Samswana

Caregivers at Samsara


