Data Insights
Construction surges around 2026 host city stadiums
June 11, 2026
Head of Insights

Get the latest from Samsara
Subscribe nowThe world’s biggest sporting event gets bigger every cycle. With the 2026 edition co-hosted across the U.S., Mexico, and Canada, host cities are renovating iconic stadiums, expanding transit networks, and reshaping the streets around match venues. For host markets, that often means one thing: a multi-year construction surge.
To understand how that buildup has played out across host cities—and when and where it has spiked—we turned to one of the most grounded indicators out there: the movement of construction vehicles. Samsara analyzed over two million construction fleet trips around 11 of the 16 host stadiums with the highest sample size, from January 2024 through May 2026. The analysis draws from real-world operational data to estimate the World Cup building surge against each stadium's historical baseline.
The data show a two-year buildup that’s now converging across every tracked host city., One venue—Monterrey’s Estadio BBVA—dwarfed every other host market in the analysis and a peak surge of +95% that hit five months before kickoff.
Let’s dig in.
+95% peak monthly surge observed in the buildup, months before kickoff | Every host city seeing construction surges in May 2026 |
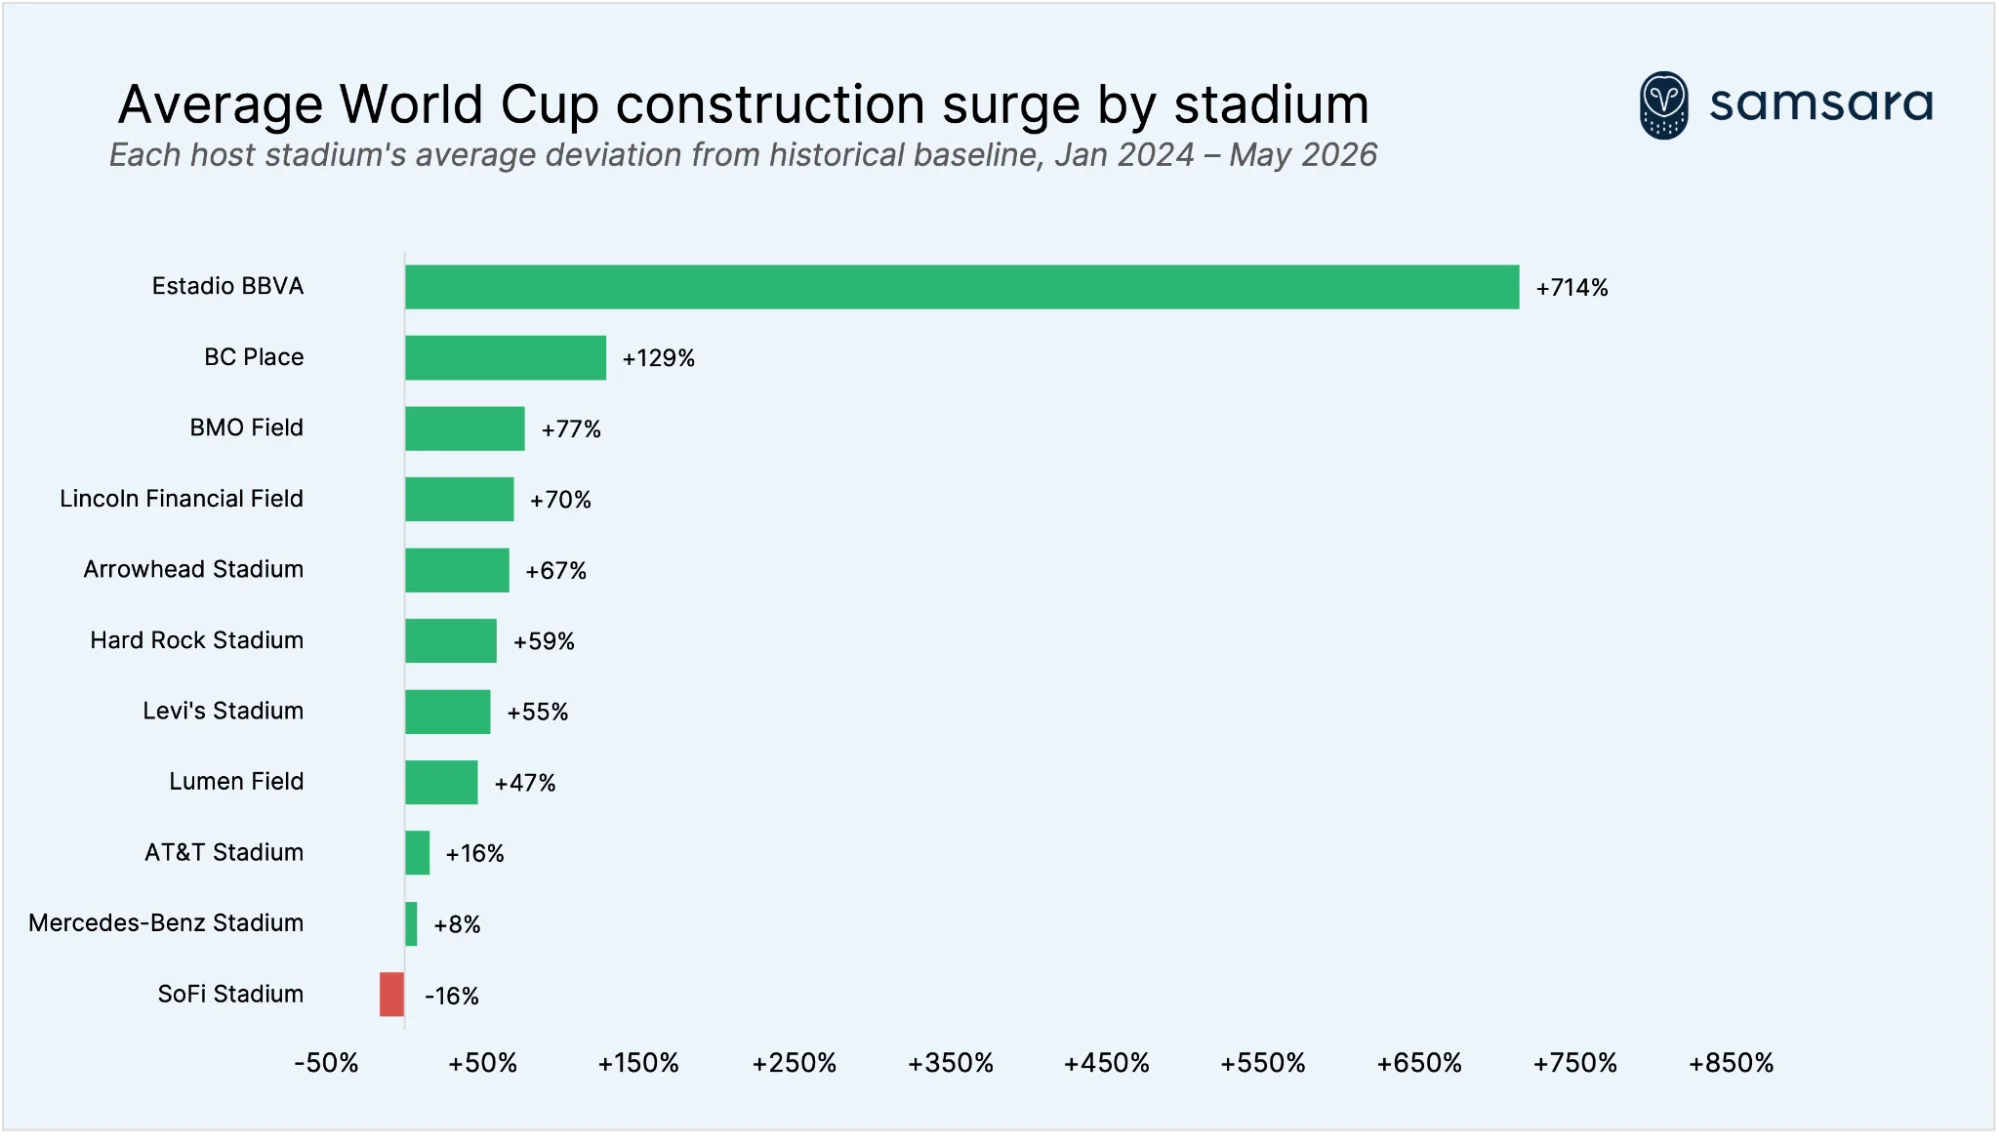
Average construction surge by stadium, Jan 2024 – May 2026
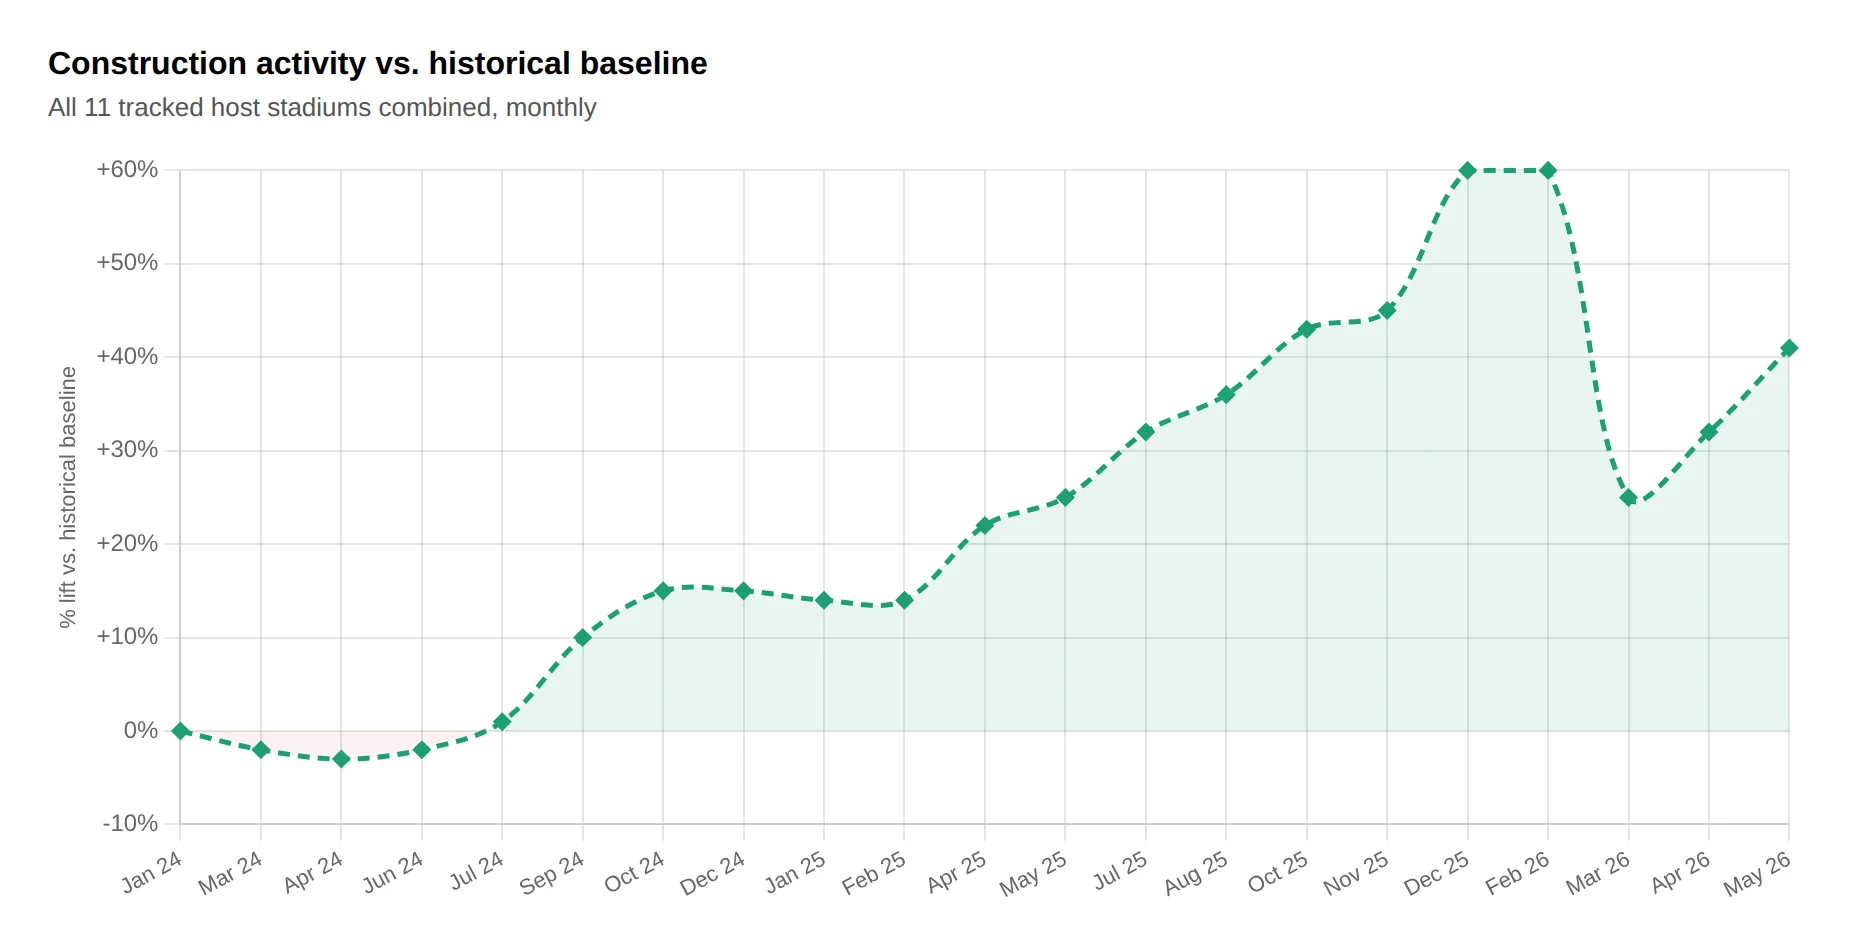
Construction buildup over time
Construction activity around the 11 tracked host stadiums ran slightly below baseline through most of 2024. The first crossover into surge territory came in October 2024, twenty months before kickoff. From there, activity climbed in waves through 2025 and early 2026.
The peak monthly lift came in January 2026, when North American activity ran approximately 95% above the historical baseline on average, reaching as high as 192% for Lumen Field in Seattle. Activity moderated through early 2026 but rebounded to roughly +41% in May. Notably, every tracked stadium ran above baseline that month — the first observed instance of all 11 moving up together, suggesting the buildup is tightening across the board in the final stretch before kickoff.
A note on the figures. These are model-based estimates rather than direct measurements of tournament-related work. A historical baseline is calculated from past behavior — controlling for Samsara’s own customer growth and broader market conditions — and actual activity is compared against it. With any statistical estimate, there are nuances that can’t be fully accounted for. Treat the percentages as directional rather than exact. Figures may be restated as the model is refined.
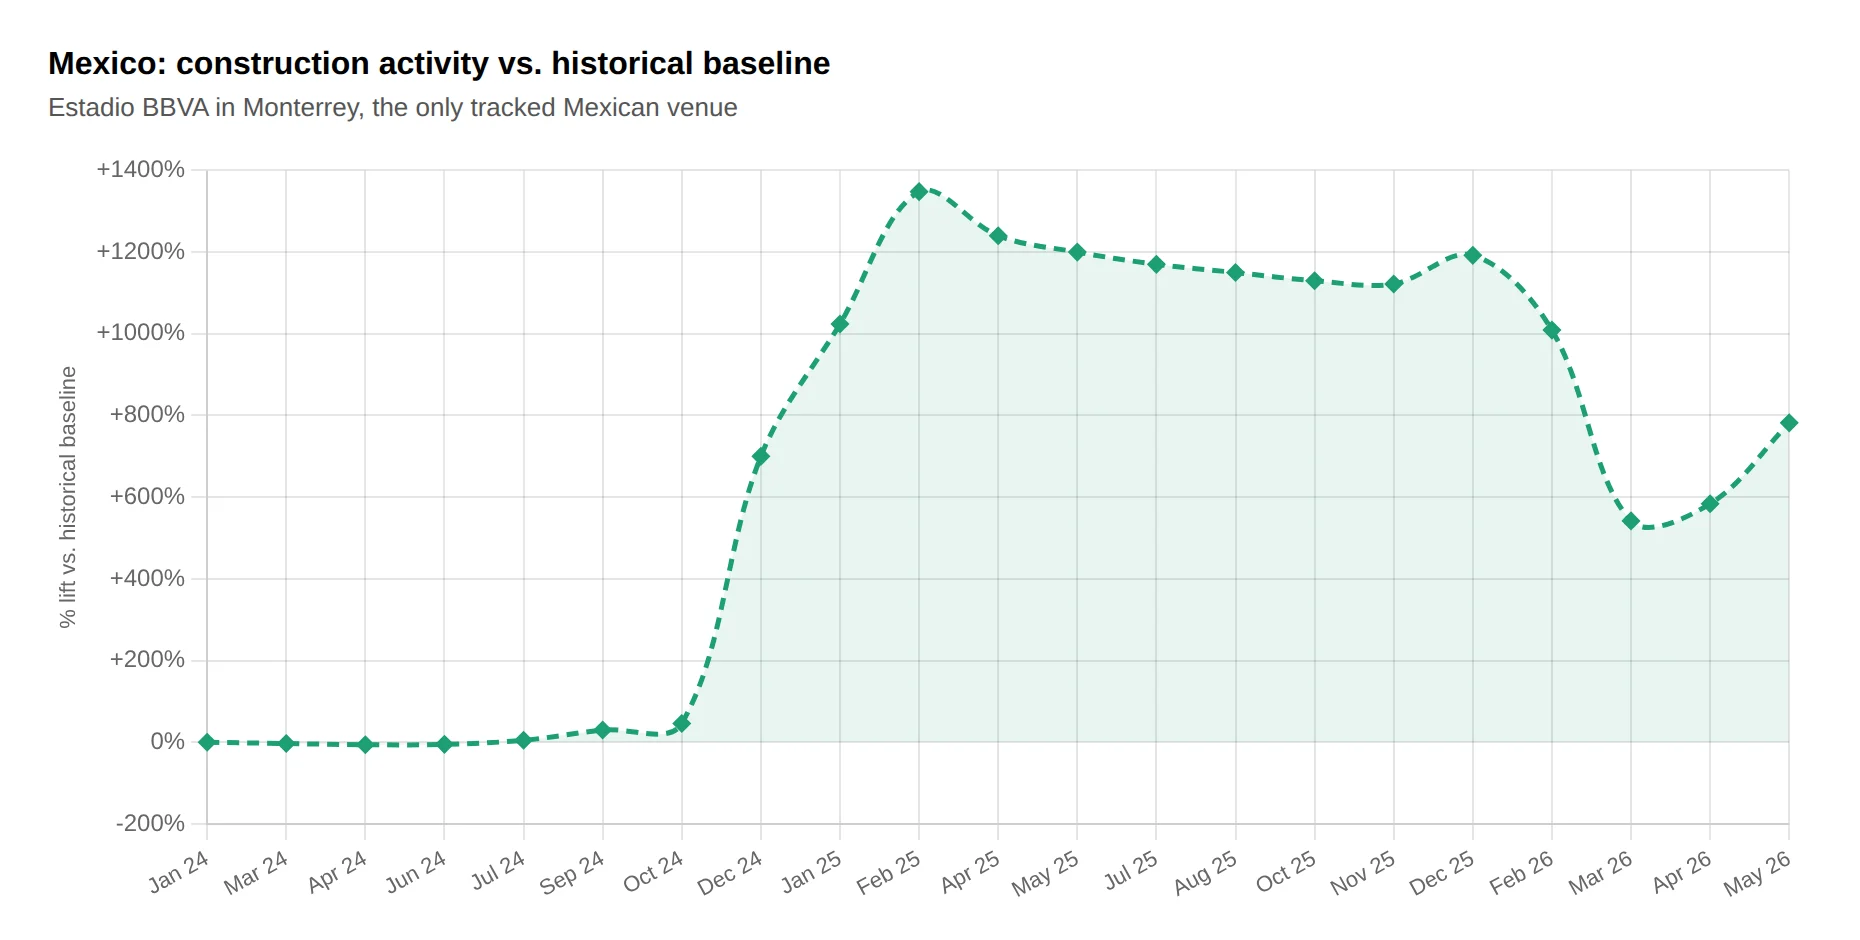
Mexico
Estadio BBVA in Monterrey has been the largest standout across the tracker. Activity around the stadium has averaged approximately 714% above its historical baseline across the two-year buildup, with a single-month peak of approximately 1,348% in February 2025. The elevated readings have held since early 2025, with May 2026 activity running approximately 782% above baseline.
Stadium | City | At peak (Feb ‘25) | May ‘26 | Stadium |
Estadio BBVA | Monterrey | +1,348% | +782% | Estadio BBVA |
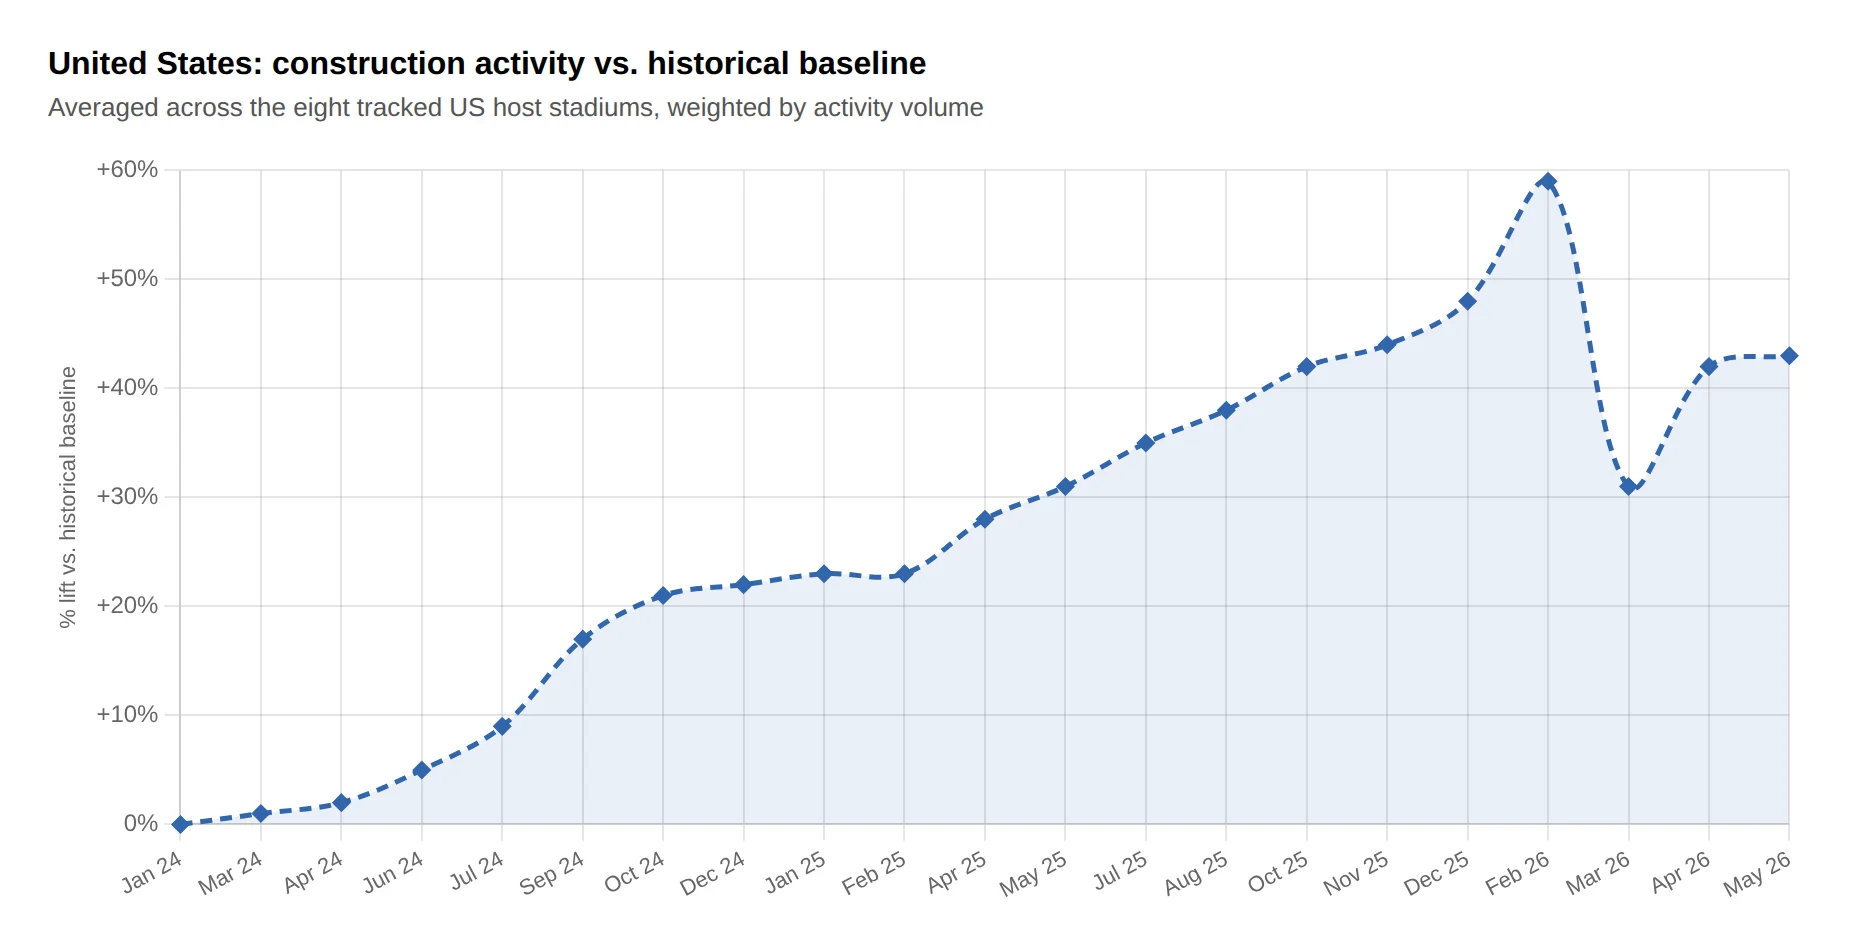
United States
The eight tracked American host stadiums show a more moderate surge than BBVA — activity is running about 43% above the historical baseline on average in May 2026, similar to April. All eight US venues are above baseline in May, including Mercedes-Benz and Lumen Field which had dipped just below in April. Lincoln Financial Field in Philadelphia, Levi’s Stadium in the Bay Area, and Hard Rock Stadium in Miami remain the strongest active signals.
Stadium | Market | At peak (Jan ‘26) | May ‘26 |
Lincoln Financial Field | Philadelphia | +115% | +116% |
Levi’s Stadium | Bay Area | +88% | +101% |
Hard Rock Stadium | Miami | +129% | +95% |
SoFi Stadium | Los Angeles | −15% | +17% |
AT&T Stadium | Dallas | +76% | +7% |
Lumen Field | Seattle | +192% | +6% |
Mercedes-Benz Stadium | Atlanta | +54% | +2% |
Arrowhead Stadium | Kansas City | +54% | +2% |
Canada
Canada’s two host venues both accelerated in May. BMO Field in Toronto rose to approximately +161%, up from +124% in April. BC Place in Vancouver climbed to approximately +137%, up from +114%. Both cities appear to be building right up to kickoff.
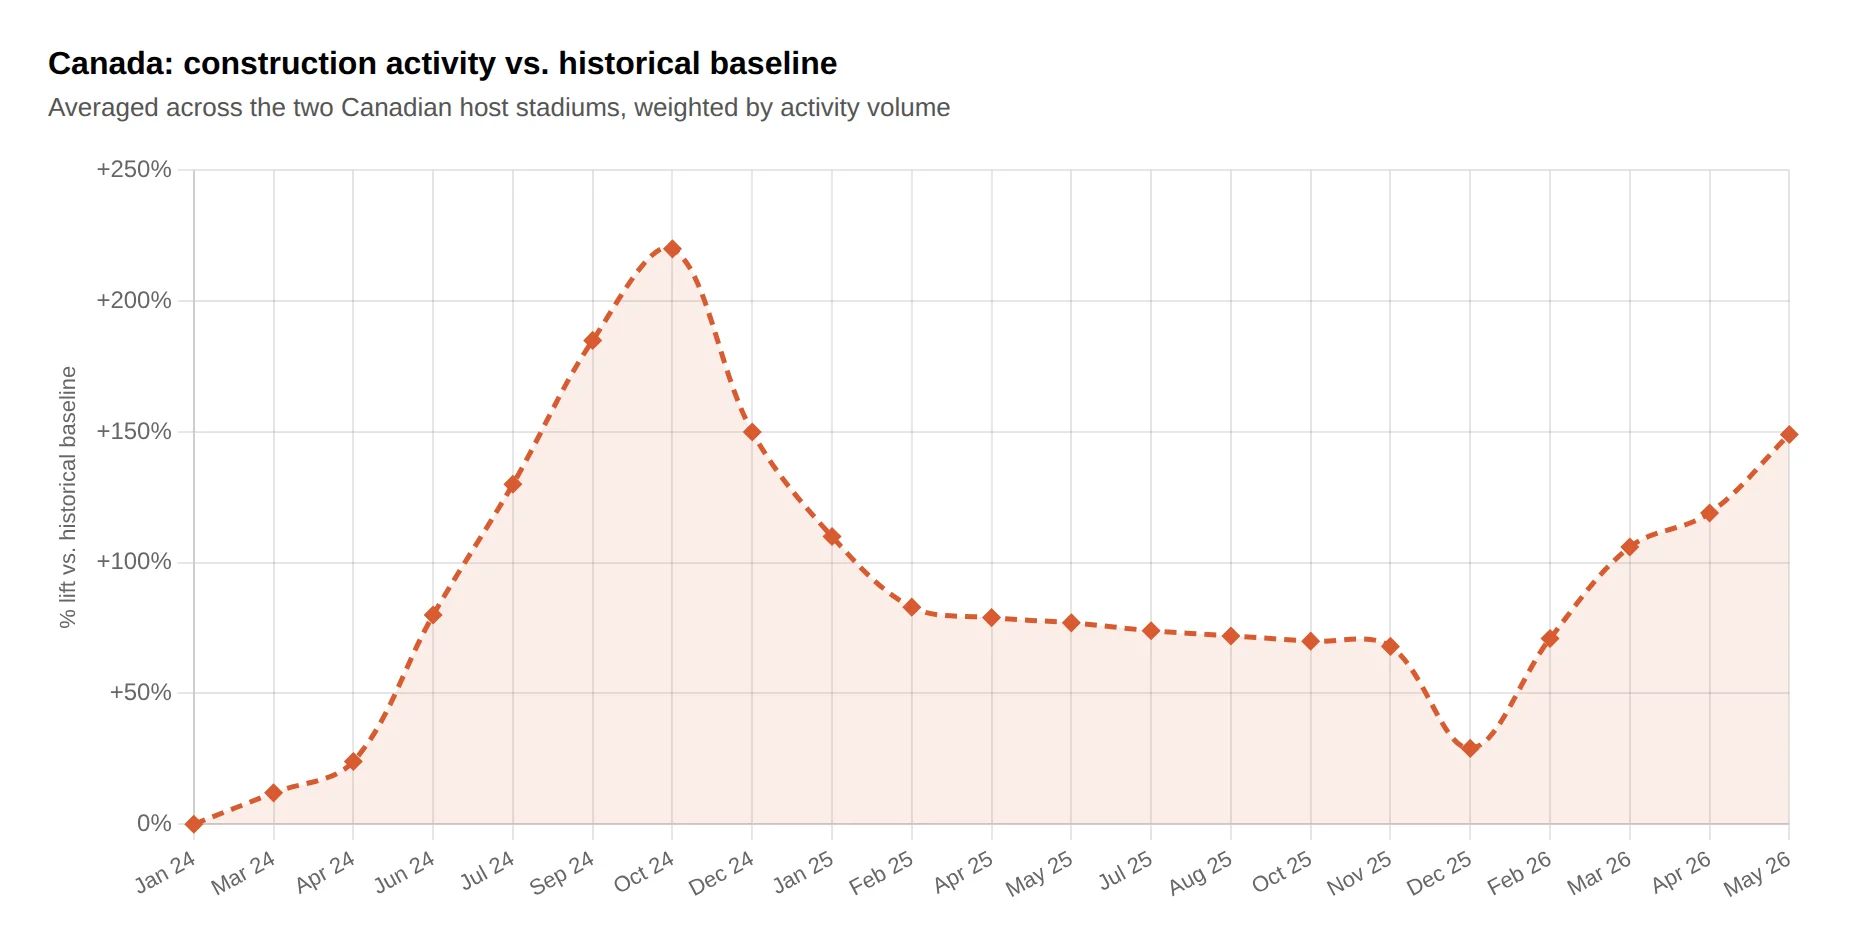
Stadium | City | At peak (Jan ‘26) | May ‘26 | Stadium |
BMO Field | Toronto | +68% | +161% | BMO Field |
BC Place | Vancouver | +157% | +137% | BC Place |
Conclusion
The construction phase of this summer’s tournament is entering its final stretch. What comes next belongs to the players, the fans, and the host cities themselves.
The numbers show when and where construction surged over the course of two years and across 3 countries — work that was made possible thanks to the operations teams who built the venues, laid the groundwork, and prepared the cities to welcome the world.
To recognize these teams, Samsara has created a set of player cards and the stories behind some of the most complex operations in the world. Learn more about these operators and the impact they’ve made, then create your own player card at samsara.com/assist.
About the data
Samsara’s technology is installed in commercial vehicles operated by construction companies across North America. This analysis tracks how often vehicles in the construction-industry fleet enter a three-kilometer radius around each host stadium, on a monthly basis from January 2024 through May 2026. The sample is restricted to the 11 host stadiums (of 16 total for the 2026 tournament) with the highest construction data coverage. Actual activity is compared to a model-based historical baseline that adjusts for Samsara’s own customer growth and broader market conditions, isolating the estimated share of trips reasonably attributable to the event itself. All figures are model-based estimates expressed as percentage activity above or below the historical baseline. Figures may be restated as the model is refined.
Get the latest from Samsara
Subscribe nowRead more


– 7 min read
Samsara Drives Cost-Savings Opportunities for Customers in their First Year

Manager, Expansion Growth

AI reveals where and when American drivers are most distracted

Senior Data Scientist

Canada’s two seasons: Winter and construction

Head of Insights