Get the latest from Samsara
Subscribe nowCanada’s winter landscape creates a driving environment unlike anywhere else in North America. Snowpack, freeze–thaw cycles, and below-freezing temperatures combine with steady year-round freight and municipal operations. To understand how these conditions affect risk, Samsara analyzed anonymized data from commercial fleets across Canada between 2022 and 2025, covering billions of kilometres driven on highways, suburban corridors, and urban arterials.
The findings show that winter is Canada’s peak season for both driving and danger. Unlike in warmer regions where fleets reduce exposure during winter, Canadian operations continue at scale—and every kilometre becomes more hazardous.
Seasonal breakdown: winter carries the highest crash load
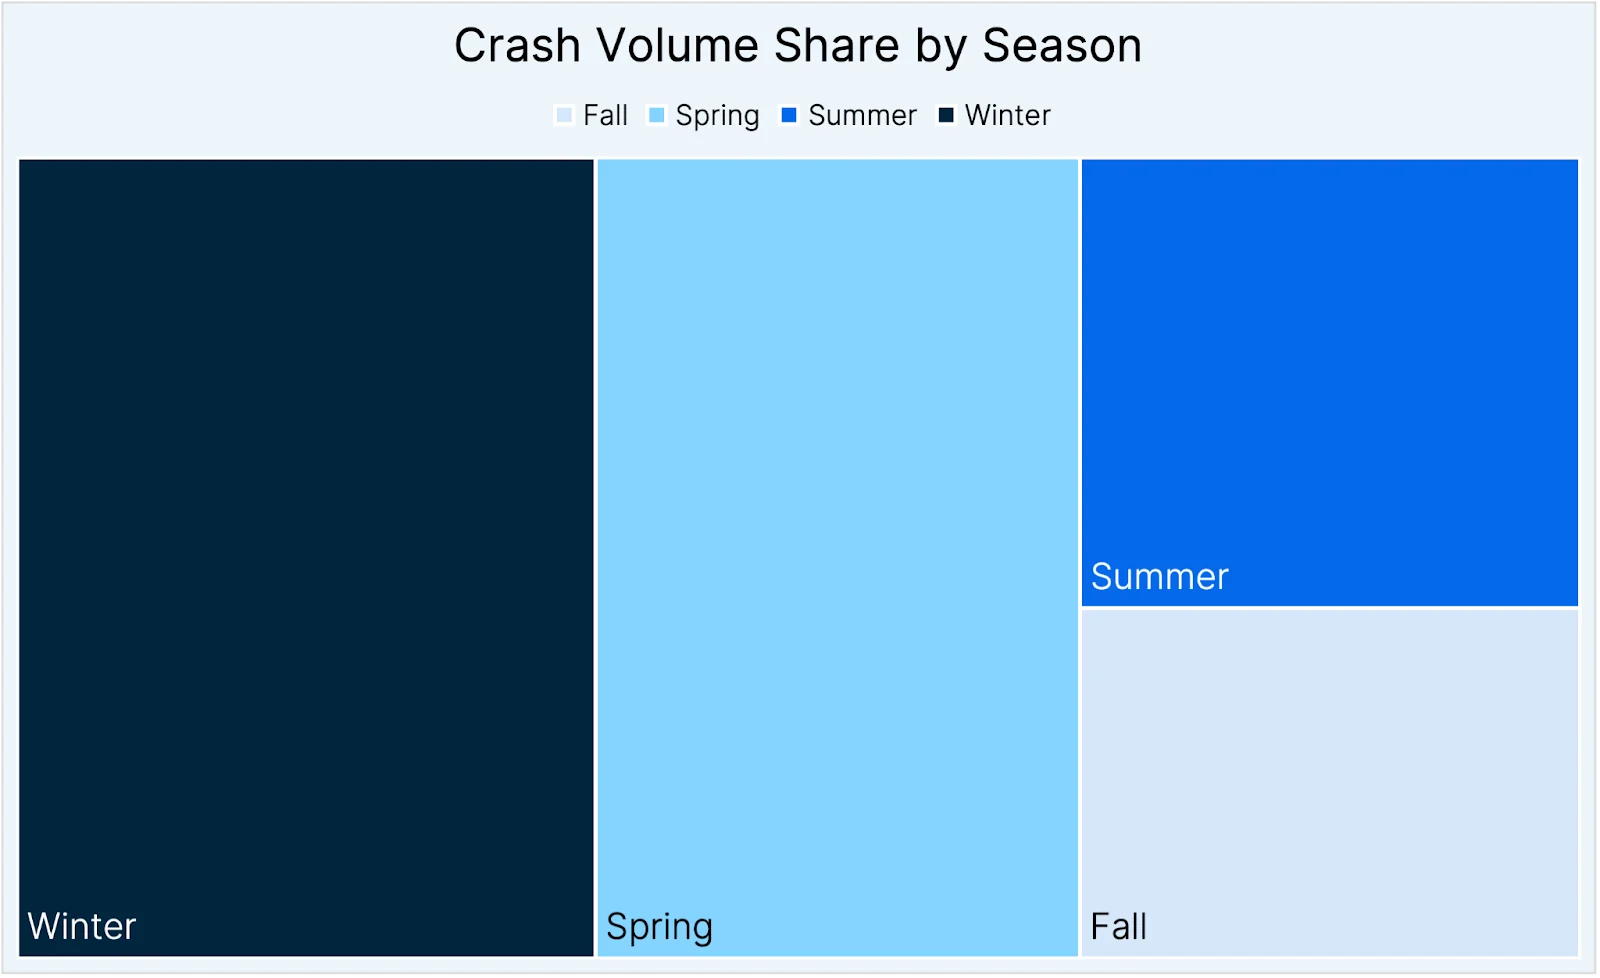
The seasonal pattern of crashes in Canada tells a clear story. Winter stands out as the busiest period for incidents, accounting for more than a third (37%) of all crashes in the dataset. Spring follows closely, reflecting another high-activity stretch. By contrast, fall and summer see far fewer crashes, each representing less than a fifth of the annual total.
Season | Share of Crashes (%) |
|---|---|
Fall | 14% |
Spring | 31% |
Summer | 18% |
Winter | 37% |
A two-peak winter: from the Christmas ramp-up to the Boxing Day restart
Weekly crash rates in the final stretch of the year reveal a sharp and predictable pattern. Risk builds steadily through late November and early December, rising 140% Week 48 to Week 51. This climb reflects the convergence of early-winter freeze conditions, holiday freight surges, and increased evening travel.
The pattern briefly softens in Week 52, when the crash rate falls. This pause does not signal safer roads; it reflects quieter roads. Traffic volume dips over the Christmas and Boxing Day break, temporarily suppressing incident counts before operations resume.
As soon as the new year begins, the trend reverses. Crash rates climb again from Week 1 to Week 3. By Weeks 3–5, rates stabilize at elevated levels driven by a return to full operations, continued cold, and limited daylight.

Wave 1: Ramp to Christmas (Weeks 48–51) Crash rates nearly double heading into Christmas as the first major freeze sets in and holiday freight accelerates. This is the fastest rise of the season.
Boxing Day dip (Week 52) The only dip of the winter occurs during Boxing Day week—not because roads improve, but because traffic briefly disappears. It’s a short-lived pause before operations resume.
Wave 2: Post-holiday restart (Weeks 1–4) Two weeks after Christmas, crash rates climb again as Canadians return from holiday and Boxing Day orders hit the roads. By Week 3, risk peaks a second time.
Christmas week: day by day

So what does this look like during Christmas week? From December 22–24, the crash rate climbs sharply—increasing 102% over just two days as pre-holiday travel, freight activity, and early-evening refreeze converge. This buildup peaks on December 24, the highest-risk day of the week.
Then the pattern reverses. On Christmas Day and December 26, the crash rate drops 46%, reflecting the short-lived lull in road activity as Canadians stay off the roads for the holiday. The underlying conditions haven’t improved—temperatures, daylight, and pavement traction remain the same—but traffic briefly thins enough to reduce incident counts before operations resume.
When danger peaks: the afternoon-to-evening refreeze
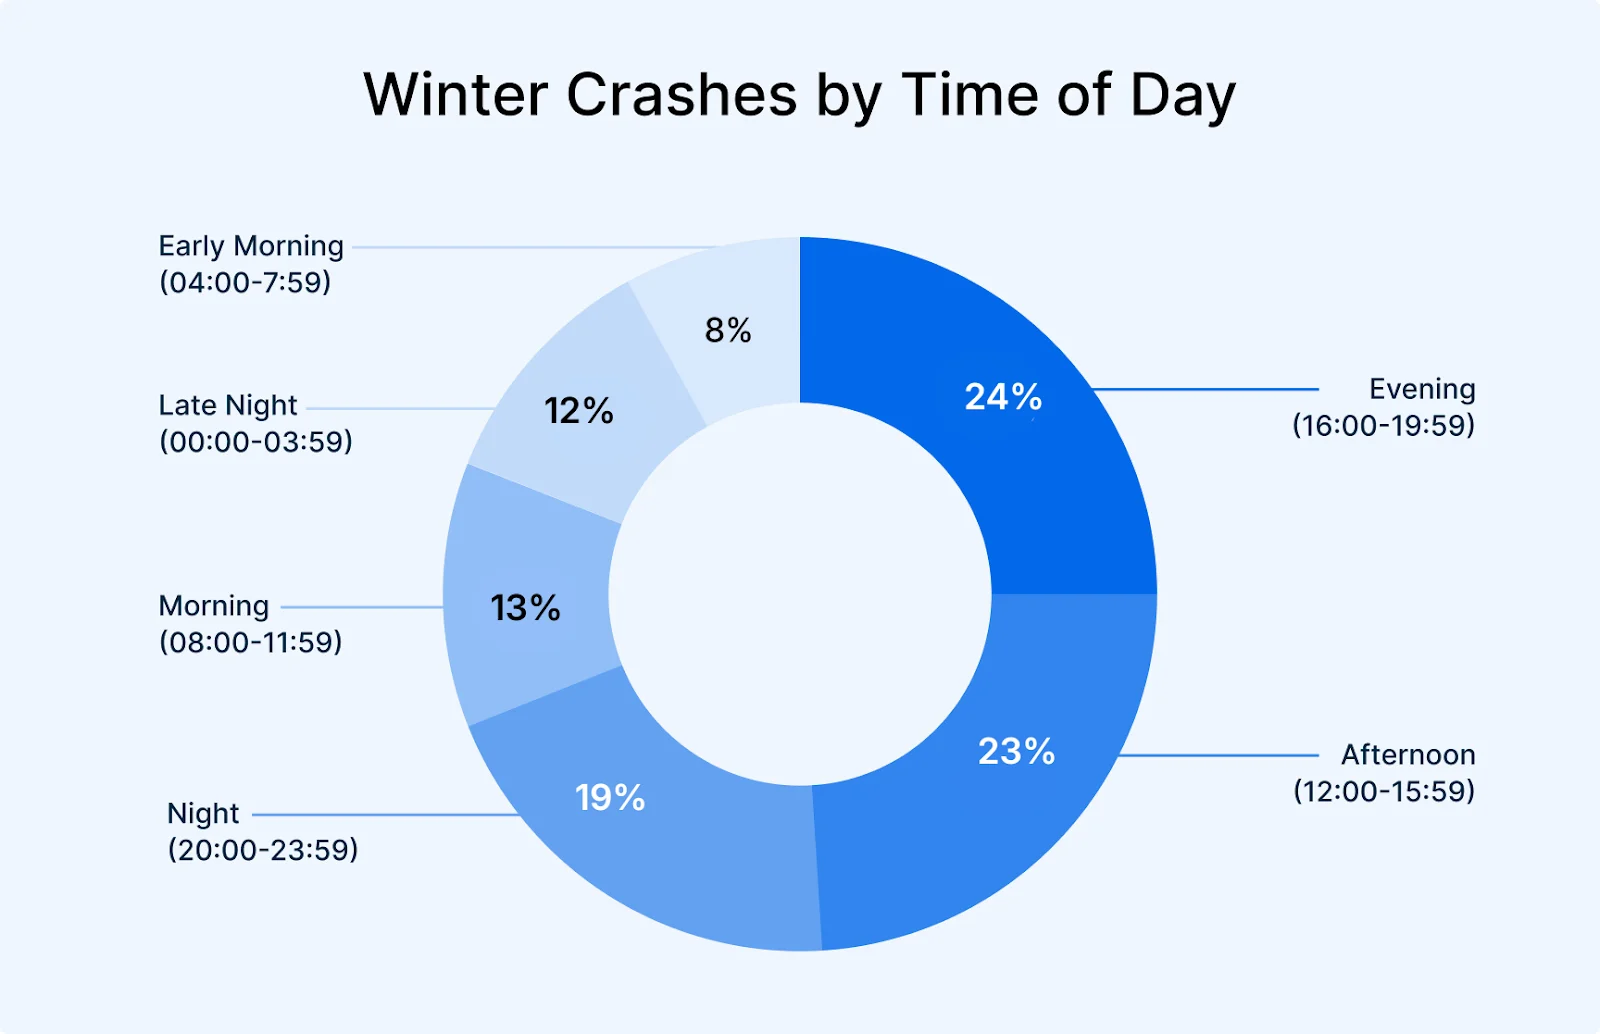
Canada’s risk curve peaks before midnight—when fleets are still active and road temperatures fall fastest. Congestion, changing pavement temperatures, and the transition from daylight to darkness combine to shrink reaction time. Nighttime hours remain especially risky as temperatures drop and visibility worsens, while late-night and early-morning periods still see serious crashes driven by fatigue and black ice.
Time of Day | Share of Crashes (Winter) | Primary Risk Factors |
|---|---|---|
Evening (4–8 PM) | 24% | Congestion + rapid refreeze |
Afternoon (12–4 PM) | 23% | Falling temps, surface glare |
Night (8 PM–Midnight) | 19% | Darkness, reduced traction |
Morning (8 AM–Noon) | 13% | Residual black ice |
Late Night (Midnight–4 AM) | 12% | Fatigue, undetected frost |
Early Morning (4–8 AM) | 8% | Pre-dawn temperature lows |
Most dangerous winter roads in Canada
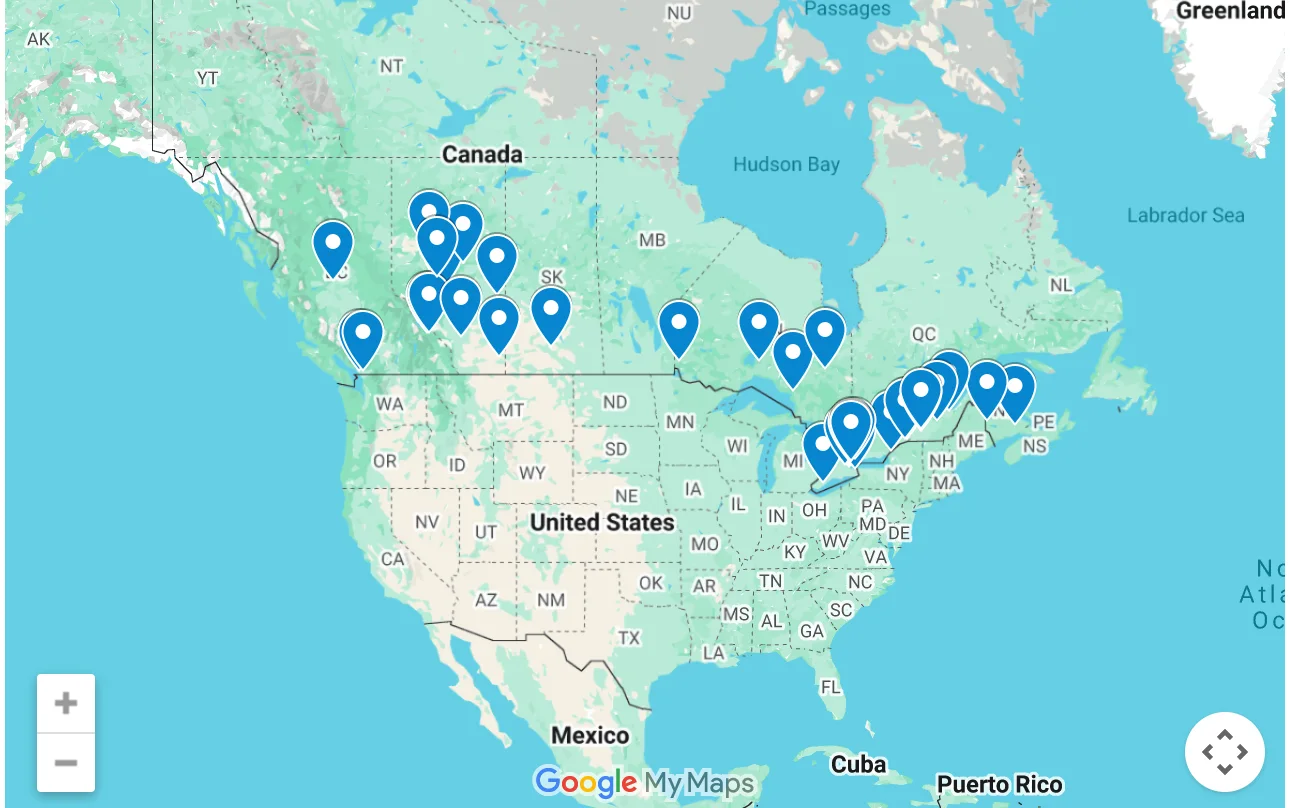
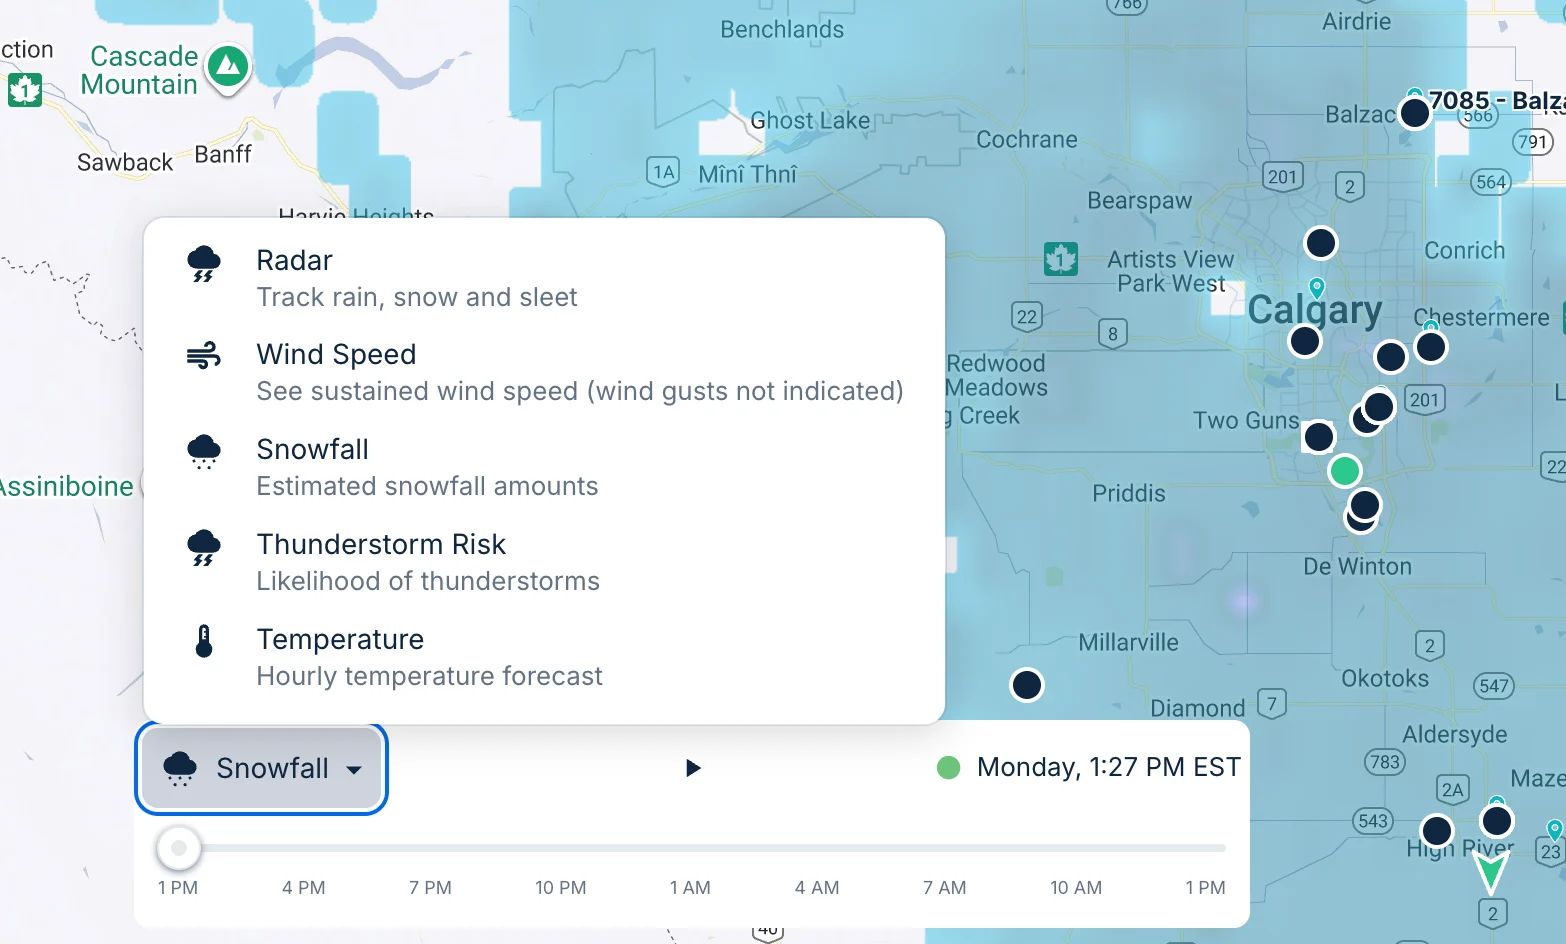
Canada’s winter crash risk isn’t evenly spread across its road network—it concentrates in specific geographic zones where weather, terrain, traffic mix, and wildlife movement collide. These hotspots tend to cluster around mountain passes with steep grades, lake-effect snow belts, forested wildlife corridors, major freight interchanges, and dense suburban logistics zones. By analyzing thousands of crash coordinates, clear patterns emerge: the Trans-Canada’s alpine segments, northern Ontario’s moose corridors, the GTA’s 401 collector–express convergence points, and coastal fog belts in British Columbia and Quebec all show elevated winter danger. To help visualize where these risks concentrate, we’ve mapped every hotspot location referenced in this section.
Rank | Roadway | Province | Key Hotspot Locations |
|---|---|---|---|
1 | Erieau Road | ON | Erieau Peninsula lake-effect strip; lakeshore curves approaching Erieau |
2 | Yellowhead Hwy (16) | BC/AB/SK | Tête Jaune Cache–McBride grades; Jasper–Hinton wildlife corridor; prairie wind segment |
3 | Highway 2 | AB | Athabasca–Slave Lake corridor; Peace River freeze–fog zone |
4 | Highway of Heroes | NB | Fredericton–Oromocto crossing; Moncton outskirts; Woodstock fog zone |
5 | Timberland Road | BC | Surrey–Fraser Valley connector; approaches to Hwy 17/freight yards |
6 | Trans-Canada Hwy (1) | BC/AB/SK/MB/ON | Rogers Pass; Lake Louise; Yoho NP; Moose Jaw–Regina corridor |
7 | Autoroute Jean-Lesage (A-20) | QC | Québec bridge interchange; river-fog segment |
8 | Steeles Avenue East | ON | Brampton–Vaughan industrial belt; 400-series approaches |
9 | Highway 43 | AB | Hinton–Edson forest edge; Whitecourt grades |
10 | Highway 17 | ON | Kenora–Dryden moose corridor; lake-effect zones |
11 | Highway 11 | ON | Hearst–Kapuskasing wildlife zone; black-ice flats |
12 | QEW | ON | Burlington Skyway winds; collector–express weaves |
13 | Industrial Park Dr (132) | QC | Salaberry-de-Valleyfield logistics zone |
14 | Highway 401 | ON | 401/403/410 complex; fog pockets; lake-effect strips |
15 | Dixie Road | ON | 401/Dixie ramps; freight corridor |
16 | Highway 401 Express | ON | Toronto core collector–express fusion zone |
17 | Coleraine Drive | ON | Vaughan CN intermodal approaches |
18 | Highway 401 Collectors | ON | Pearson east approaches; Renforth–Dixon weaving |
19 | Rue J-A-Bombardier | QC | Boucherville industrial belt |
20 | Route Marie-Victorin (132) | QC | River-adjacent freeze–thaw curves; fog strip |
Top 10 nationwide winter hotspots
These are the most notable hotspot segments, across all roads:
Erieau Road – Erieau Peninsula lakeshore (ON) Lake-effect snow, narrow two-lane geometry, and shoreline curves between Chatham-Kent and Erieau.
Trans-Canada Highway – Rogers Pass and Yoho National Park (BC) Steep grades, avalanche exposure, and tight curves between Golden, Rogers Pass, and Lake Louise.
Trans-Canada Highway – Banff–Lake Louise (AB/BC border) Heavy tourist and freight mix, wildlife crossings, and frequent snow squalls.
Yellowhead Highway – Jasper–Hinton corridor (AB) Elk and moose crossings, forested curves, and fast-changing mountain weather.
Yellowhead Highway – McBride–Tête Jaune Cache (BC) Narrow mountain valley, grade changes, and patchy traction.
Highway 17 – Kenora–Dryden (ON) Long, dark two-lane stretches through dense moose habitat, with limited passing and shoulders.
Highway 11 – Hearst–Kapuskasing (ON) Extreme cold, limited lighting, and wildlife movement along remote boreal forest segments.
Queen Elizabeth Way – Burlington Skyway (ON) Crosswinds, elevated structure over Hamilton Harbour, and heavy truck volumes.
Highway 401 – Mississauga interchange complex (ON) 401/403/410 interchange zone with dense freight traffic, frequent lane changes, and winter refreeze on ramps.
Highway 401 Express/Collectors – Toronto core (ON) Collector–express weave between Pearson and Scarborough with high density, spray, and rapid refreeze on overpasses.
A connected approach to safer roads
Winter road conditions change faster than drivers can respond—pavement friction can drop within minutes as temperatures fall, and visibility declines earlier and more sharply. To balance out seasonal effects and operate a program anchored in safety, fleets need to shift incident response from reactive to preventative.
Increase real-time in-cab coaching Use in-cab alerts to help drivers adjust in the moment when road or visibility changes occur.
Continuously monitor weather and road conditions Use Weather Intelligence and StreetSense to track changing conditions at the street level and alert drivers before they enter severe weather or black ice zones.
Expand visibility around the vehicle AI dash cams and multi-cam setups provide 360-degree awareness, critical during longer dark hours and snow, rain, or fog.
Coach ahead of the risk curve Samsara surfaces patterns in risky driving behavior so fleets can coach before these patterns escalate into incidents.
Proactively adjust operations Use operational data to reroute, re-time trips, reduce schedules, or shift workloads when conditions deteriorate.
Seasonal solutions
Challenge | What changes in winter | Samsara solution |
|---|---|---|
Black ice is invisible until it's too late | Surfaces freeze faster overnight and in shaded highway segments. | Weather Intelligence highlights freeze risk zones and pushes alerts before drivers reach them. |
Crash risk spikes between midnight and 4 a.m. | Fatigue, impaired visibility, rapidly falling temperatures. | StreetSense™ and telematics identify which night routes and segments show the greatest risk, enabling route/time adjustments. |
Risk varies even within a single city or county | Elevation, microclimates, salt coverage, and wind exposure differ by road. | StreetSense™ provides segment-level scoring so fleets prioritize mitigation where it matters most, not systemwide. |
Not all drivers respond the same way to conditions | Coaching is often too generic or delivered too late. | In-cab AI delivers real-time alerts and adaptive coaching during conditions, not after. |
Moving from awareness to preventative action
Taking the following actions produces a step-change in how organizations manage winter operations:
Identify high-risk roadways and corridors using segment-level StreetSense™ scoring
Re-route or re-time trips based on Weather Intelligence forecasts
Real-time in-cab coaching for drivers most exposed to night or freeze conditions
Trigger operational changes (pretreatment, chain-up protocols, shift adjustments) before conditions cross thresholds
The result is not just fewer crashes, but fewer delays, fewer emergency responses, fewer claims, and fewer out-of-service vehicles when fleets are needed most. Understanding these patterns, and acting on them before exposure, is what truly reduces winter risk at scale.
To learn more about how Samsara safeguards against winter weather risks, visit Samsara's Weather Intelligence.
Get the latest from Samsara
Subscribe nowRead more

Using technology to improve compliance, equipment tracking, and safety across Western Canada

VP of Fleet Services, Freight North Group of Companies

How tappCONNECT is scaling safer, more efficient passenger transit

Chief Operating Officer, tappCONNECT

How Sunrise Farms’ Director of Fleet and Livehaul led digital transformation with a lean team

Director of Fleet and Livehaul, Sunrise Farms

Why thousands of companies in the retail industry choose Samsara

EVP, Chief Operating Officer - GTM

How American Iron & Metal strengthened their safety culture and reduced accidents by 85%

Manager Transportation Safety & Compliance, American Iron & Metal

Caron Transportation Systems’ Dieter Blank on why safety starts with smart tech

Sr. Director, Customer Marketing

Sterling Crane Canada on transitioning to proactive maintenance to overcome harsh conditions

Regional Maintenance Manager, Sterling Crane Canada

Women at the wheel: How tech unlocks new opportunities in Canadian trucking

Vice-président principal, EVO Transportation et évangéliste Samsara

The state of digitalization in 2025: Lessons from a DHL safety leader

Senior Project Manager – Safety Programs, DHL