New Features
A New Way to View Your Industrial Sites, Plants, & Equipment
January 17, 2020

Get the latest from Samsara
Subscribe nowOur industrial customers’ businesses are dependent on the smooth operation and coordination of hundreds, if not thousands, of interconnected assets. And with each asset generating vast amounts of data every second, finding relevant information can quickly become a challenge.
At Samsara, we strive to give our customers unprecedented visibility into their organizations, recognizing that data is only as good as the tools that help you use it. That’s why today we’re excited to announce the launch of two all-new ways to organize and visualize data. Now, you'll be able to create an asset-centric view of your entire organization that mirrors your physical operations. And with our all-new visualization designer, you'll be able to create graphical dashboards to model your assets using a set of drag-and-drop components.
These new features will help you get more immediate value from your data by structuring it in a way that makes the most sense to your business
Organize data in a way that makes sense for your business
No two organizations operate in quite the same way, which means that no two manage information in the same way. That’s why we’re giving you complete flexibility to define and organize your assets in any way you want whether that’s as geographic sites, systems, equipment, or all of the above.
With simple dropdown menus, it’s easy to add or remove assets and nest them in the parent-child relationships that make sense for your business. And once you’ve defined your assets, you can use the tag feature to give specific users access to the subset of assets they are responsible for.
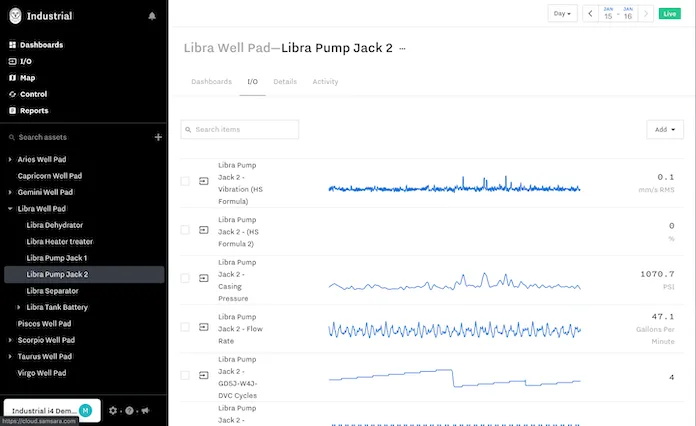
One place for relevant data
Once an asset is created, all of its data is grouped in a central place, so you and everyone on your team can find the information you need quickly and easily. This includes real-time sensor data, alerts, and historical trend data. Additional details like the asset’s location, service dates, or any other custom metadata can also be added to help facilitate maintenance processes.
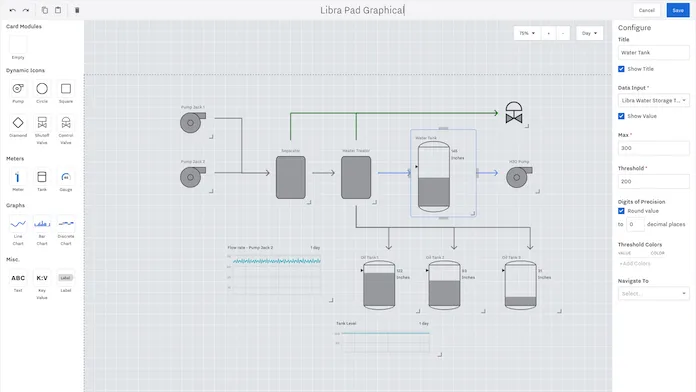
Visualize your assets in new ways
Under the dashboards tab for each asset, you and your stakeholders can now create multiple types of custom dashboards for any given asset. Executive teams can track high level production metrics using grid dashboards, while maintenance technicians can take advantage of an all-new graphical view to see a virtual representation of physical assets. Like all Samsara dashboards, the new graphical view is easy to build with drag and drop components and can be replicated across assets.
Speed up troubleshooting
With assets front and center, troubleshooting issues is faster than ever before. In the new UI, the information and analytics to help determine the root cause of issues like downtime or low production rates are just a few clicks away. Using our analysis tools, you can view historical data trends and compare similar assets in order to determine if any asset is behaving abnormally.
Try it yourself today
Existing customers will have the option to opt-in to these new features starting today, and all new customers will receive these enhancements going forward. If you’re interested in trying Samsara for the first time, reach out for here.
Get the latest from Samsara
Subscribe nowRead more


New innovations from Samsara help fleets find and recover the hidden operational costs

Director, Product Marketing


New AI-powered Weather Intelligence enhancements to improve safety for any season

Senior Product Marketing Manager

Introducing Samsara’s satellite solution: Connectivity, anywhere, anytime

Director, Strategic Markets Product Management and Hardware Product Manager

4 of Samsara’s Most Game-Changing New Releases of Spring 2023

Senior Customer Program Manager, Learning & Enablement

4 of Our Most Impactful Product Releases of 2022
Senior Customer Program Manager, Learning & Enablement

