
At Samsara, we provide real-time data to our customers while ingesting millions of events per minute from thousands of connected devices. The software that powers this is thunder, an open-source GraphQL framework built in-house. Thunder consists of multiple parts, including a SQL generator called sqlgen. This post covers how we added a feature to sqlgen, the 33% increase in allocations and 66% memory increase that it resulted in, and how we returned to our baseline numbers following some optimizations.
Building a new feature: Adding support for JSON columns
What is sqlgen?
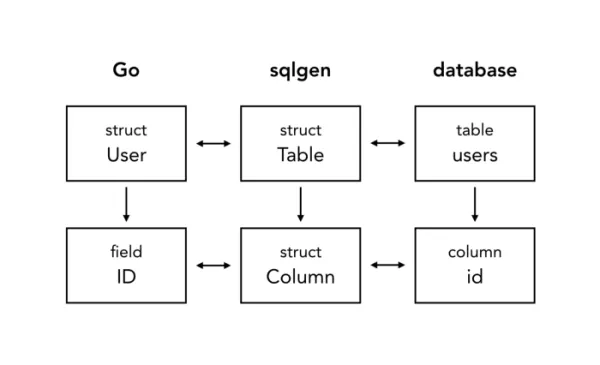
sqlgen is a lightweight pseudo-ORM that maps database tables to their Go representations and reduces boilerplate code. Before we dive into the feature we added or its design, let’s establish a base-level understanding of sqlgen.
A given table and corresponding model:
CREATE TABLE users (
  id   BIGINT NOT NULL AUTO_INCREMENT PRIMARY KEY,
  name VARCHAR(255)
);
type User struct {
	ID   int64 `sql:",primary"`
	Name string
}
is represented in sqlgen like this:
Storing JSON in the database
On the product infrastructure team, part of what we do is identify points of friction that prevent our engineering team from using good practices, and eliminate them. One such pattern we saw was using JSON blobs to store data in the database. sqlgen didn’t have an easy way to do this, so people were forced to do something like this:
CREATE TABLE users (
  id            BIGINT NOT NULL AUTO_INCREMENT PRIMARY KEY,
  name          VARCHAR(255),
  configuration JSON
);
type User struct {
	ID   int64 `sql:",primary"`
	Name string
	// The go struct representation of our data.
	Configuration Configuration `sql:"-"`
	// The JSON blob to be stored in and fetched from the database.
	ConfigurationBlob []byte `graphql:"-" sql:"configuration"`
}
func (s *UserRepository) Update(ctx context.Context, u *User) error {
	// Serialize the configuration struct into JSON
	b, err := json.Marshal(u.Configuration)
	if err != nil {
		return err
	}
	// Set the blob to be saved to the database
	u.ConfigurationBlob = b
	return s.DB.Update(ctx, &u)
}

func (s *UserRepository) ById(ctx context.Context, id int64) (*User, error) {
	var user *User
	if err := s.DB.QueryRow(ctx, &user); err != nil {
		return nil, err
	}
	// De-serialize the JSON from the database into the Go struct
	if err := json.Unmarshal(user.ConfigurationBlob, &user.Configuration); err != nil {
		return nil, err
	}

	return user, nil
}
As you can see, the simple act of encoding and decoding some configuration data added a second representation for the configuration, as well as an additional step on any read or write paths (in this case, Update and ById).
We instead wanted our API to be simple and to use one representation for data outside of the database. What we wanted was something like this:
type User struct {
	ID            int64 `sql:",primary"`
	Name          string
	Configuration Configuration `sql:",json"`
}
func (s *UserRepository) Update(ctx context.Context, u *User) error {
return s.DB.Update(ctx, &u)
}
func (s *UserRepository) ById(ctx context.Context, id int64) (*User, error) {
	var user *User
	if err := s.DB.QueryRow(ctx, &user); err != nil {
		return nil, err
	}

	return user, nil
}
Planning it out: Wrangling Go interfaces
To add JSON support in sqlgen, we had to wrap our (de)serialization layers to allow for arbitrary transformations. Thankfully, Go’s sql package has support for this.
In the statement below, there are two serialization directions being traveled:
Go → SQL (
id)SQL → Go (
name)
id := 5
var name string
err := db.QueryRowContext(ctx, "SELECT name FROM users WHERE id = ?", id).Scan(&name)
Go → SQL
When id is serialized into a SQL value by a SQL driver’s parameter converter, the driver will automatically handle conversion for driver.Values: int64, float64, bool, []byte, string and time.Time — as well as the driver.Valuer interface.
type Valuer interface {
	Value() (driver.Value, error)
}
SQL → Go
Similarly, on the read path, Scan supports pointer types to driver.Values, as well as a sql.Scanner interface.
type Scanner interface {
	// the docs tell us that the src will be a valid driver.Value
	Scan(src interface{}) error
}
Armed with this information, we now knew what interfaces to implement to handle JSON (de)serialization, as well as what types to work with!
After discussion and prototyping, we landed on this design for sqlgen’s type system:
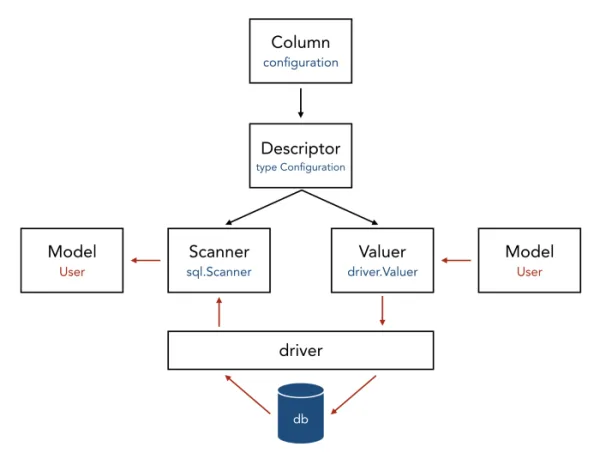
The red arrows represent the flow of data
The Descriptor keeps track of all type information needed, as well as providing the ability to generate both Scanner and Valuer proxies for values. The Valuer translates a struct value into a driver.Value. Finally, the Scanner translates a driver.Value back into our struct value.
type Descriptor struct {
	Tags TagSet       // struct tags
	Type reflect.Type // the original type
	Kind reflect.Kind // the underlying kind
	Ptr  bool         // whether or not it's a ptr
}
// For a given column:
var valuer driver.Valuer = column.Descriptor.Valuer(reflect.ValueOf(""))
var scanner sql.Scanner  = column.Descriptor.Scanner()
Making it real: Identifying and fixing performance issues
We implemented the plan above, and added tests and benchmarks. We then deployed this change to our canary GraphQL server to gauge its performance under a real workload. As it turns out, there’s no data like production data. The code was unacceptably inefficient when it came to memory allocation.
Our benchmarks had indicated an increase of allocations of 33%. We deemed this potentially acceptable if the real-world impact wasn’t drastic. However, our canary test indicated a spike of 66% in memory usage over time. It was time to go back to the drawing board.
Using pprof to find memory problems
The first thing we did was take a look at some of our profiling tools. For local profiling, we highly recommend checking out this post on the official Go blog. At Samsara, we automatically run pprof when our servers are under higher than expected load. This provides us with a representative insight into our memory allocations.
Taking a look at an SVG representation of our pprof reports, we can see a few hints of where the problem might be:
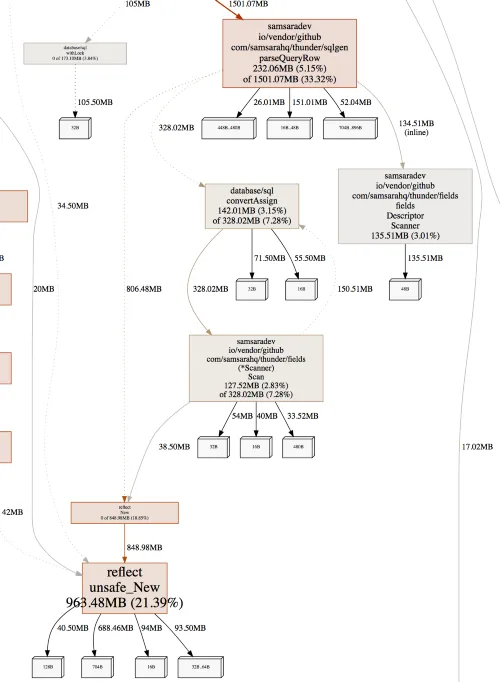
Looking at our inuse_space report, we see a new 3% of allocations being used on Descriptor.Scanner, as well as 2.8% of allocations being used in Scanner.Scan.
These numbers might seem low, but around 75% of our heap is consumed by our cache. We suspect that these additional allocations are putting a strain on Go’s garbage collector. We also think that we can provide better hints to Go’s escape analysis to prevent some of these allocations.
Starting with a benchmark
A great starting point when trying to find issues or improve performance is to write a benchmark. This is something Go makes very easy. For this task, we created two benchmarks. Our Go benchmark, an integration test of our CRUD path in sqlgen, served as our micro-benchmark. Our macro-benchmark was a test server against which we ran simulated traffic using a tool we built specifically for this.
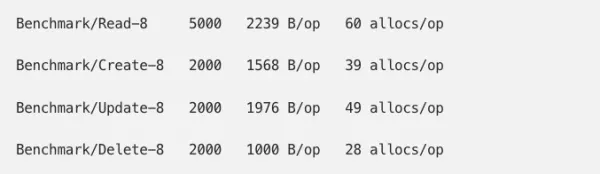
Our original allocations looked something like this:
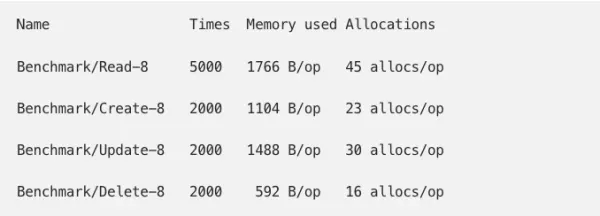
whereas our new code had 33% more allocations on the read path:
When running a simulated load of read-only traffic against the test server, we were able to reproduce our 66% increase in memory from these allocations. We set our goal: reduce allocations and get within 10% of original memory usage. Our main focus would be the read path, as this our hottest code path.
Optimization 1: Pass by value
The first optimization became clear from just looking at the code. Scanner and Valuer hold onto Descriptor pointers. However, our methods for creating new Valuers and Scanners didn’t use *Descriptor. Go functions are pass by value, meaning all values passed into functions, even pointers, are copies. Because we were copying the value, rather than a pointer to the value, we were allocating an entirely new Descriptor on the heap for each Valuer and Scanner.
By making a few quick tweaks:
// Valuer creates a sql/driver.Valuer from the type and value.
-func (d Descriptor) Valuer(val reflect.Value) Valuer {
+func (d *Descriptor) Valuer(val reflect.Value) Valuer {
-	return Valuer{Descriptor: &d, value: val}
+	return Valuer{Descriptor: d, value: val}
 }

// Scanner creates a sql.Scanner from the descriptor.
-func (d Descriptor) Scanner() *Scanner { return &Scanner{Descriptor: &d} }
+func (d *Descriptor) Scanner() *Scanner { return &Scanner{Descriptor: d} }
we were able to significantly reduce both the objects and bytes allocated:
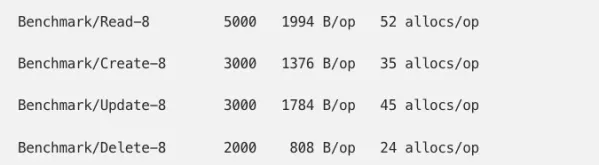
and achieve a 10% decrease in memory usage, bringing us to 50% higher than baseline (from 66%).
Optimization 2: Cutting out the middleperson
We noticed in our pprof reports that our reflect.New allocations had jumped by 15%. Our initial approach was to initialize Descriptor.Scanner with a reflect.New value, which we would move to our model struct with a CopyTo method. By crossing a couple method boundaries, however, we were causing our model’s intermediary values to be heap allocated.
We decided on a new approach of allocating directly to the final model struct.
// goodbye reflect.New in Scanner.Scan
func (s *Scanner) Scan(src interface{}) error {
-	s.value = reflect.New(s.Type)
+	// Clear out the value after a scan so we aren't holding onto references.
+	defer func() { s.value = reflect.Value{} }()
	// ...
}

// and hello Scanner.Target
+func (s *Scanner) Target(value reflect.Value) {
+	s.value = value
+}
and rather than scanning into a new value and then copying to our model, we target our final destination directly:
func parseQueryRow(table *Table, rows *sql.Rows) (interface{}, error) {
	ptr := reflect.New(table.Type)
	elem := ptr.Elem()

	values := make([]interface{}, len(table.Columns))
-	[... populate scanners slice with column.Descriptor.Scanner() ...]
+	for i, column := range table.Columns {
+		scanner := column.Descriptor.Scanner()
+		scanner.Target(field)
+		values[i] = scanner
+	}

	if err := rows.Scan(values...); err != nil {
		return nil, err
	}
-	for i, column := range table.Columns {
-		scanners[i].CopyTo(elem.FieldByIndex(column.Index))
-	}

	return ptr.Interface(), nil
}
By cutting out the middleperson, we were able to shave off an additional allocation per column on a model.
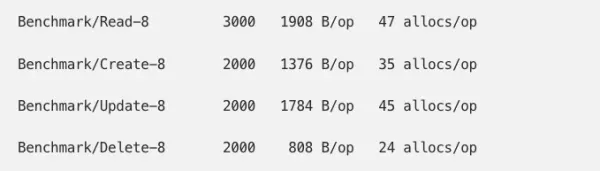
This resulted in another memory decrease of 7.5%, bringing us to 39% above baseline. Steady progress towards our goal!
Optimization 3: Re-use of allocations
pprof also tells us that about 3% of our non-cache memory is being used for Descriptor.Scanner. If we look at our code, we can see that our Scanners are escaping to the heap, since we are passing them to rows.Scan. Go’s standard library has sync.Pool, an API that allows us to re-use allocations, creating new allocations only when accessed concurrently.
What do we know? We know that our columns are almost always accessed together. We also suspect that we aren’t de-serializing data concurrently that frequently, since IO timing would likely spread accesses apart. So, we should be able to create a sync.Pool per Table and re-use the same scanners.
func parseQueryRow(table *Table, rows *sql.Rows) (interface{}, error) {
	// ...
-	values := make([]interface{}, len(table.Columns))
+	values := table.Scanners.Get().([]interface{})
+	defer table.Scanners.Put(values)

	for i, column := range table.Columns {
-		scanner := column.Descriptor.Scanner()
-		scanner.Target(field)
-		values[i] = scanner
+		values[i].(*fields.Scanner).Target(field)
	}

	if err := scanner.Scan(values...); err != nil {
	// ...
}
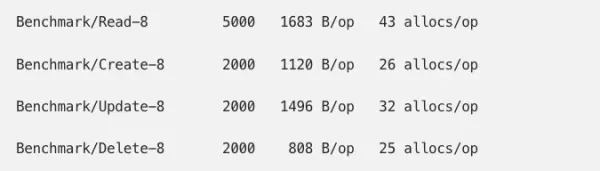
If we run our benchmarks, we’re immediately down 4 allocations per benchmark row. This makes sense as our benchmark isn’t concurrent, so we should be re-using the pool 100% of the time. When we run our traffic simulation, we see CPU and response times stay the same, and get an 8% dip in memory usage (28% above baseline). Another step closer to our goal.
Optimization 4: Preventing escape of complex data types
At this point, we have gone through the hints provided by pprof and made optimizations where we can. We have mostly focused on the Scanner, as it’s the most obvious candidate for read path optimizations.
However, our other Valuerabstraction is something we haven’t really inspected, and it’s used extensively on the read path, when making WHERE clauses.
It’s worth noting here that interface{} acts like a pointer across function boundaries. That means that when we allocate our Valuer’s value, it’s going to escape onto the heap.
Because we passinterface{}… to our SQL driver, we know that a value has to be allocated to the heap. However, our value is more expensive than a valid driver.Value would be, as it includes at least itself and a Descriptor reference.
What we can do here is make a change so that we only allow the simpler data types to escape to the heap:
func makeWhere(table *Table, filter Filter) (*SimpleWhere, error) {
	for name, value := range filter {
		// ...
-		l = append(l, whereElem{column: column, value: column.Descriptor.Valuer(reflect.ValueOf(value))})
+		v, err := column.Descriptor.Valuer(reflect.ValueOf(value)).Value()
+		if err != nil {
+			return nil, err
+		}
+		l = append(l, whereElem{column: column, value: v})
	}
	// ...
}
and verify with our benchmarks:
We don’t see a decrease in our read benchmark — and that matches our expectations since it should only go down when WHEREs are included. What we can do is add an additional “read where” benchmark:
Benchmark/Read_Where-8 3000 506274 ns/op 2394 B/op 58 allocs/op
Benchmark/Read_Where-8 2000 589746 ns/op 2346 B/op 56 allocs/op
Each filter value causes a 2-alloc decrease. But what’s the impact with real traffic? We run our traffic simulation again to find…

A whopping 17% decrease in memory usage, which means we are now using only 5.6% more memory than our baseline. Mission accomplished!
Other optimizations
There are other optimizations we considered but did not implement. We could make our benchmarks more informative by comparing them to using a basic SQL driver. We could also pre-compute custom types on initial run, saving CPU cycles on subsequent code paths.
There is probably a plethora of other optimizations we can make. It’s always a trade-off between moving fast and making code fast. Since we’d already met our goal of getting within 10% of original memory usage, we were happy to call it for now.
Moving forward
Since making these allocation improvements, we did another production canary release to test how the new implementation performs. The CPU usage and memory consumption were virtually identical to our master branch.
Since starting down this optimization path, we decreased our GraphQL server’s memory usage by 50% to match what it was before adding the new feature. We even brought down read path allocations, which should result in less garbage collection over time.
Most importantly, we were able to ship sqlgensupport for JSON fields!
What did we learn?
Building and optimizing this feature taught us:
Heap allocations are expensive. Repetitive, short-lived heap allocations are especially expensive, even when the values themselves are small, since they take time to be garbage collected.
Wrapping values on a hot path combined with the above can be a problem.
sync.Poolcan help us re-use allocations on hot paths.Benchmarks are useful, and establishing baselines upfront can help avoid performance regressions.
There is no replacement for production data.
Over to you
As programmers, battle stories like this one are always great learning experiences — for those involved, and those that we can tell them to. Do you have your own story to tell? We’d love to hear it in the comments below!
If you want to try out our open-source GraphQL framework, you can find thunder on GitHub. We’d love to hear about your experience with it too.
Finally, if you’re looking for a job, Samsara has many more challenges like this one and we’re hiring!
Special thanks to everyone who reviewed the code in question: Changping Chen, Jelle van den Hooff, Stephen Wan & Will Hughes. And an extra special thanks to the main editor of this post, Kavya Joshi.
Read more

Building the First Industrial-Grade Asset Tag at Samsara

VP of Product & Engineering


How Samsara India’s R&D Team Will Transform Physical Operations and Your Career

VP of Engineering & India Site Lead


Improving CI/CD with a Focus on Developer Velocity

Senior Software Engineer