Engineering At Samsara
Reducing Costs for Large Caches in Go: Eliminating the Memory Overhead of the Garbage Collector
February 17, 2022
Senior Staff Software Engineer

If you work with Go, here’s something that might surprise you: the Go heap incurs a 100% memory overhead. Most of the time, you don’t have to worry about this, but if your Go application uses an exceptional amount of memory relative to CPU, the overhead can end up significantly increasing your operational cost.
In this blog post, we’ll cover:
Why Go’s garbage collector has a 100% memory overhead
How to assess whether the overhead is a significant issue for your application
How you can trade off memory overhead for CPU overhead and how you can reason about the effects of that tradeoff
How you can eliminate the memory overhead without increasing CPU overhead, by managing the memory outside of the Go heap
At Samsara, we build the Connected Operations Cloud, which has a core function of storing and serving the time series data coming from our customers’ IoT devices. To give a feel for the size of this data, our systems record an average of more than 5 billion data points per day across our customers’ more than 1 million connected devices. Because we need to be able to serve requests for large amounts of this data at low latency, our caching systems are a fundamental piece of Samsara’s infrastructure — and an expensive piece.
After a deep investigation into reducing the operational costs for our caching systems, we’ve been able to achieve a 95% overall reduction (!). This article is the first in a series where we’ll explain each major step in this cost-reduction effort — starting with how we changed our approach to memory management in Go, which cut our systems’ costs by one third.
Why the Go garbage collector incurs a 100% memory overhead
The size of a process’s Go heap is roughly 200% the size of the amount of reachable data in the heap. For example, a Go process that has 1 GiB of live heap data will use 2 GiB of memory. Let’s see why Go programs have this behavior and when this overhead can be an issue.
The Go garbage collector is designed to balance the two dimensions of its overhead: memory and CPU. In other words, it’s designed to strike a balance between how much garbage can accumulate before being freed (which increases the process’s memory requirement) with how much CPU the process spends collecting garbage. The primary trigger for a garbage collection cycle is when the application has allocated a significant amount of memory compared to the amount that was in use at the time of the previous garbage collection. Go’s default configuration for this relative amount of memory is 100% (see Go’s internals: mgc.go). For example, if a process had 1 GiB of heap in use when its previous garbage collection cycle completed, it will run its next garbage collection cycle once it allocates an additional 1 GiB from the heap. The result of this approach is that a standard Go program uses about double the amount of live heap space in total memory costs.
Figure 1 relates how the sizes of three key aspects of an imaginary Go process vary as the process allocates objects and as objects become unreachable.
The “live heap” consists of the objects that are still reachable and could be used. In an actual Go process, the size of the live heap is only measured periodically because it’s expensive to compute, but this diagram shows what its value would be if it were continuously computed.
The “total heap” contains the live heap plus the objects that are no longer reachable.
Finally, the “heap goal” is Go’s target for how large it will allow the total heap to become before Go finishes the next garbage collection cycle.
The graph shows that the size of the live heap increases and decreases as objects are allocated and become unreachable, whereas the size of the total heap decreases only after a garbage collection cycle. Because a garbage collection cycle can run at any time, the process may use an amount of memory that is 200% of the maximum size of its live heap. (To read further about when garbage collection runs, check out Go developer Austin Clements’ design doc for Go’s concurrent garbage collector pacing.)
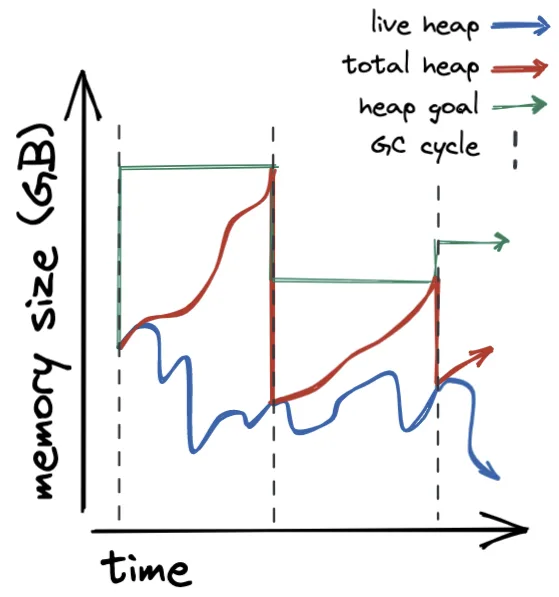
Figure 1: An illustration that contrasts the size of Go’s live heap, total heap, and heap goal. Go runs a garbage collection cycle each time the size of the total heap reaches the heap goal. After each cycle Go resets the heap goal to 200% the size of the just-collected total heap.
Measuring the memory overhead
We’ll verify that this explanation matches the behavior of an actual program, using code that models the memory use of an RPC server as shown in Figure 2. Like an RPC server, this program repeatedly allocates memory and uses it momentarily. From our description of the Go garbage collector and given that the program uses 64 MiB of live heap to process requests, we expect the program to use about 128 MiB of total heap.
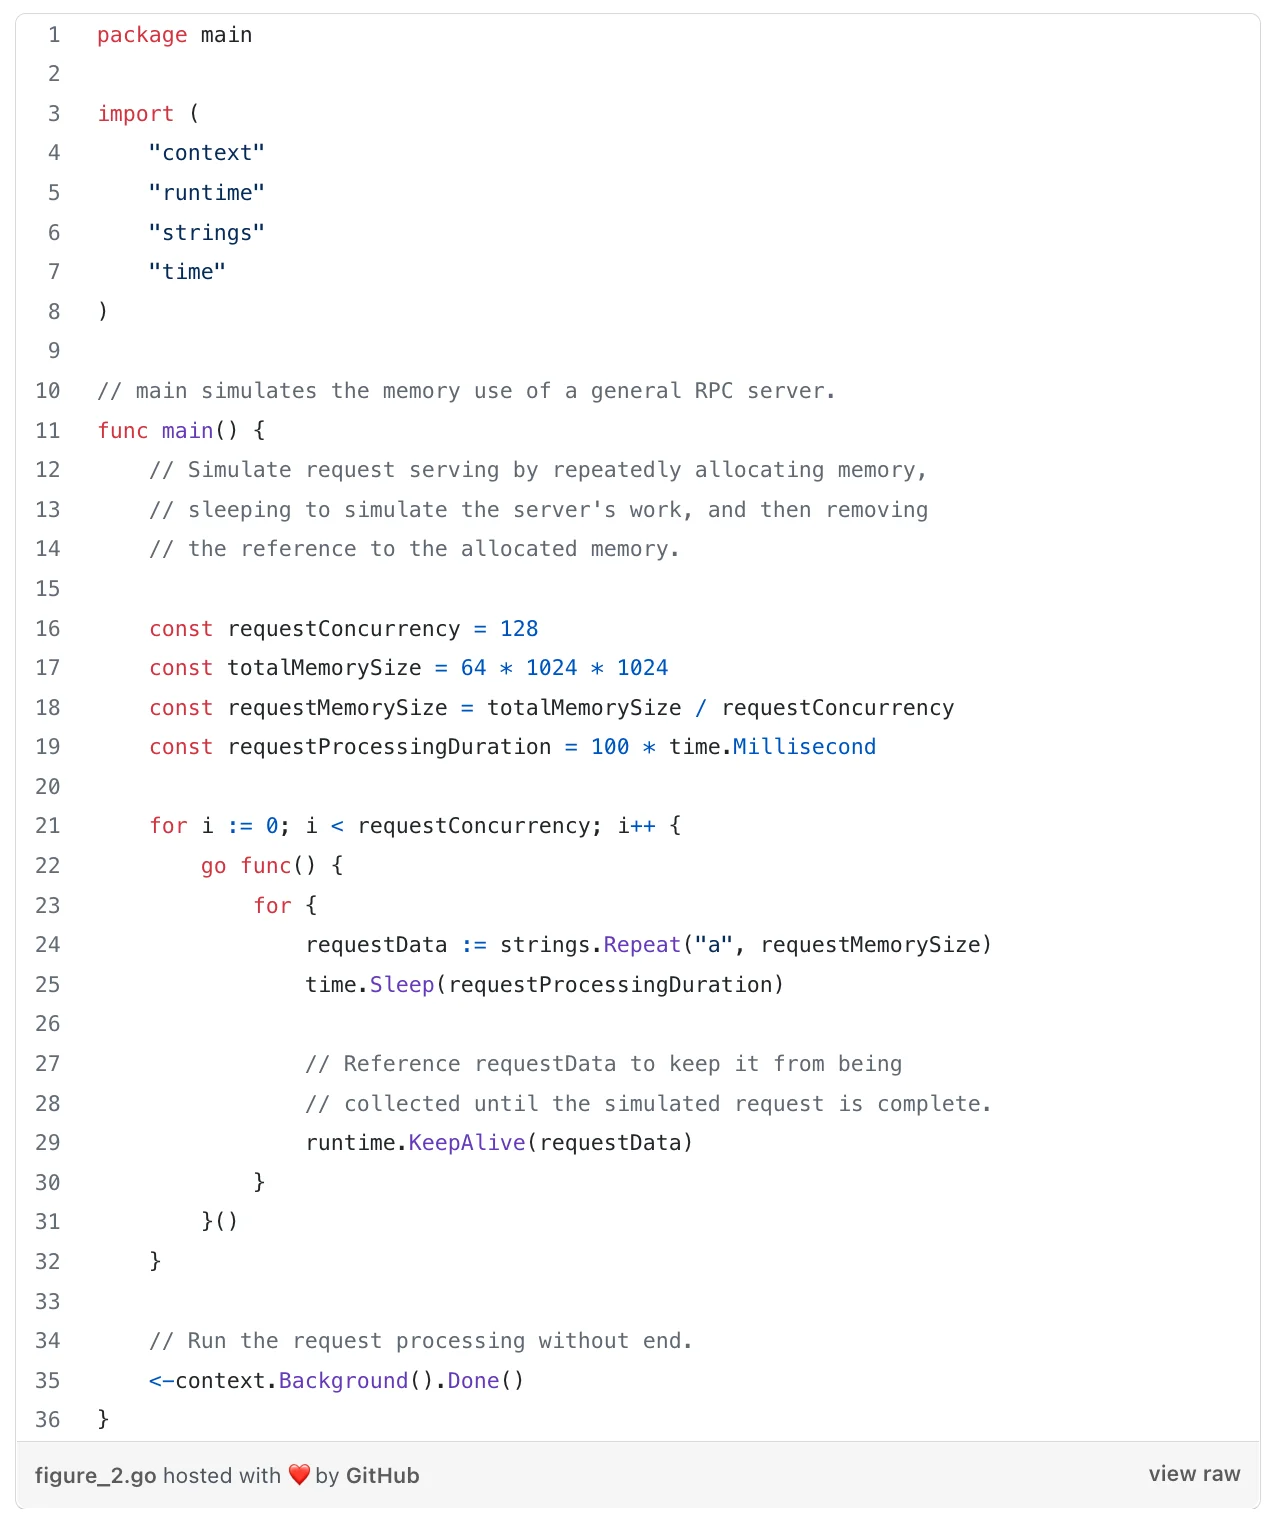
Figure 2: Go program that simulates the heap behavior of a general RPC server.
Running this program on Linux, the kernel shows that the process uses 134 MiB of memory. (Compiled with Go 1.17, running on the amd64 architecture, and memory size read via the proc file /proc/<pid>/status.)
We can see memory usage at the level of the Go heap and garbage collector by enabling logging for the garbage collector (setting the environment variable GODEBUG=gctrace=1). Figure 3 shows output from these traces. The size of the live heap after each garbage collection is about 64 MiB and each time the garbage collector decides it will next run when the heap grows to about 130 MiB. The additional 4 MiB that the process is using could reasonably be allocations made outside of the Go heap, such as from the C heap and from statically allocated data. Therefore, these values check out as matching the prediction from our description of how the garbage collector works.
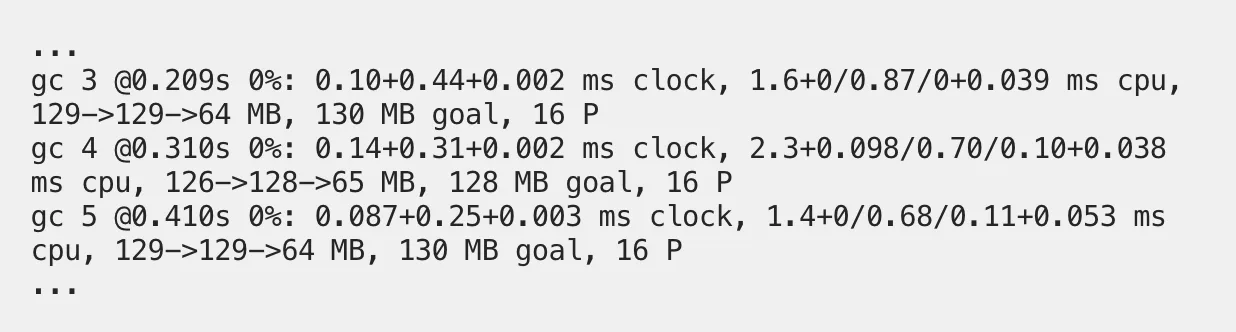
Figure 3: Go’s gctrace output for the program shown in Figure 2. Documentation for the output.
When the memory overhead is an issue
Doubling the amount of memory a program uses sounds like significant overhead, but as a result, the Go garbage collector is able to keep its CPU overhead relatively small (typically less than 10%). (For more on the principles behind this Go decision, see Go developer Rick Hudson’s talk Getting to Go: The Journey of Go’s Garbage Collector, in particular the expectations for future CPU speed vs. DRAM capacity increases.)
Indeed, Samsara has found that the tradeoff works well for most backend systems we run, because it doesn’t significantly increase hardware costs. This is due to the resources that applications commonly use compared to what hardware provides: applications tend to be CPU-bound (they use most of each computer’s CPU time) and not memory-bound (they use only about half of each computer’s total memory). As a concrete example, at Samsara the most common Go application shapes for our systems have a ratio of 1 CPU to 2 GiB of memory, the same ratio that the computers they run on provide (e.g., the AWS general-purpose EC2 instance typeC6i). For most of our systems, if we could remove the garbage collector’s memory overhead, it wouldn’t reduce the number of computers we use and so wouldn’t reduce costs.
We’re diving into the Go garbage collector, however, because for some workloads at Samsara the memory overhead does significantly increase costs. We’ve run into this issue with components of our time series database, which caches large amounts of customer data in memory to serve requests at low latency. These caching components aren’t like typical applications—they’re memory- rather than CPU-bound, and so incur significant cost increases from the garbage collector’s memory overhead.
To measure the memory overhead for a system that runs a large cache, in Figure 4 we’ve extended Figure 2’s RPC server to add a large (1 GiB) cache. The expected size of the live heap is now 1,024 MiB (cache) + 64 MiB (requests) = 1,088 MiB. We’d expect the amount of memory used to be about 200% of that, which is 2,176 MiB. The kernel shows that this program uses 2,248 MiB of memory, which roughly matches that prediction. At the level of the Go heap, the gctrace output shows that the size of the live heap is about 1,100 MiB and that the garbage collector sets the heap goal to about 2,200 MiB, which also both match our expectations. As you can see, with large caches the additional cost incurred by the memory overhead of the Go garbage collector can become significant.
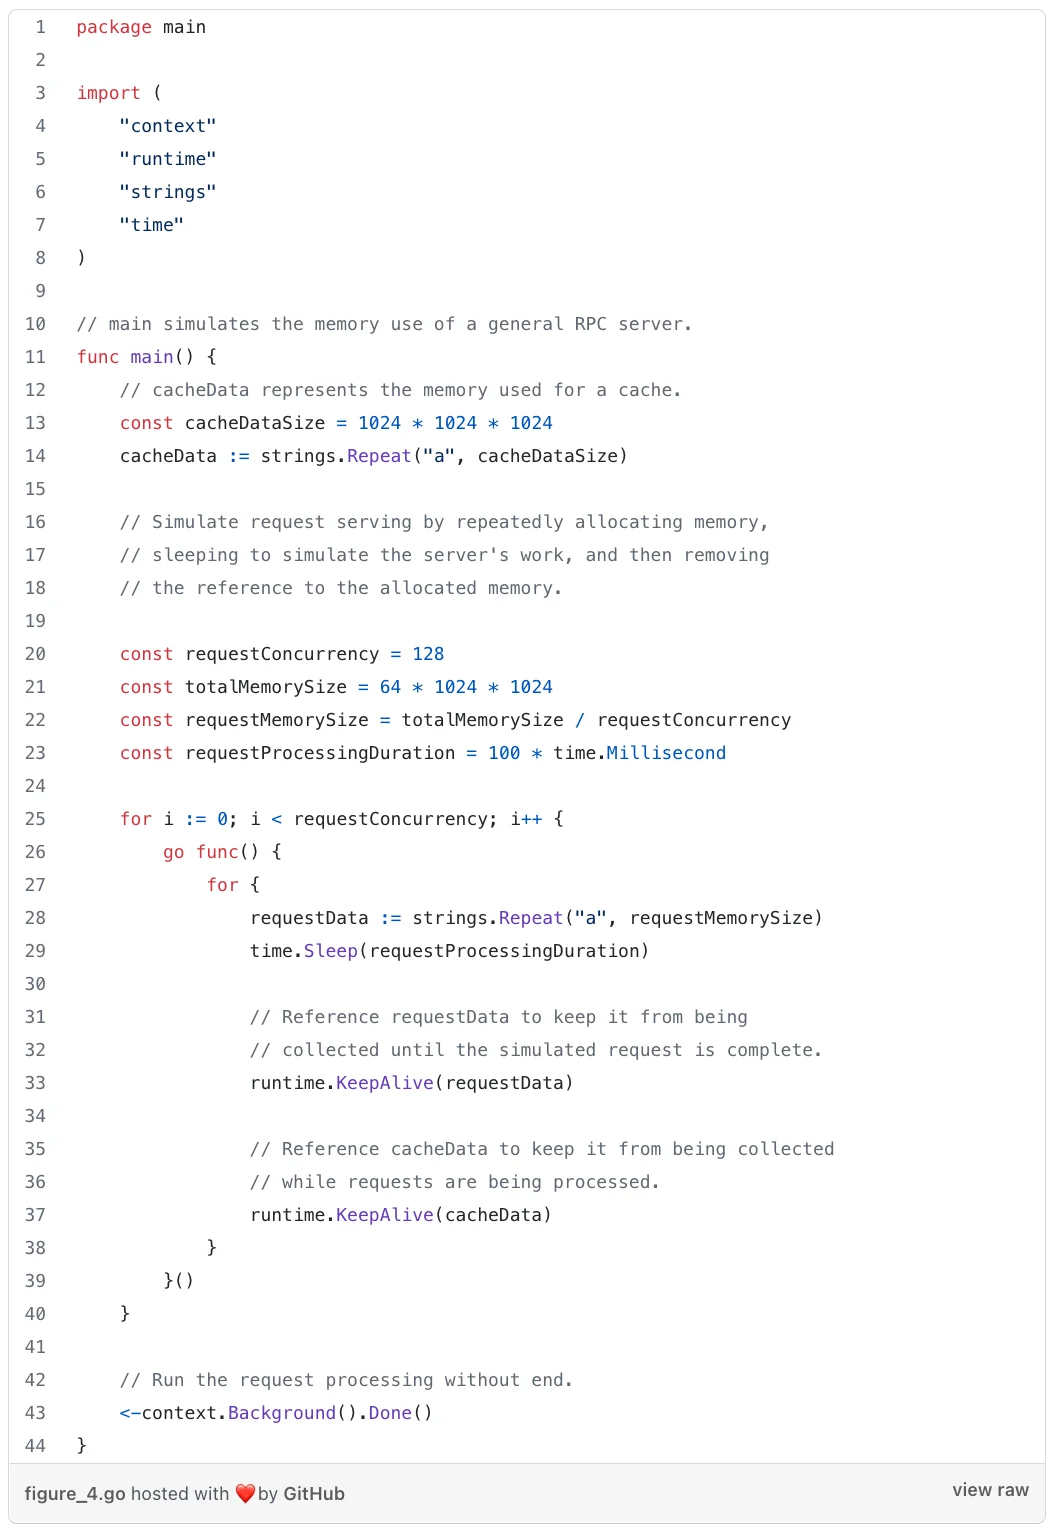
Figure 4: The simulated RPC server shown in Figure 2, extended to also simulate a cache. (The additions are lines 12–14 and 35–37.)
Reducing the memory overhead
One way to reduce the memory overhead of the Go garbage collector is to collect garbage more frequently. As a result, there will be less garbage at the end of each cycle, and less memory in the heap.
Go lets developers set what it calls the garbage collection target percentage via the environment variable “GOGC” and the Go function “debug.SetGCPercent”. At the end of each garbage collection cycle, Go multiplies the size of the live heap by this target percentage to set how much additional memory the process is allowed to allocate before running another cycle. As you’ve probably guessed already, the default target percentage is 100%. To reduce the memory overhead, you can reduce the value of GOGC — from 100% to 10%, for instance.
But there’s a drawback to decreasing the memory overhead this way: it increases the CPU overhead. When garbage collection happens more often, more objects will live across many garbage collection cycles. Since each cycle analyzes every reachable object, this means each cycle does more work, increasing the total amount of CPU time used by the garbage collector.
The relationship between memory and CPU overhead will vary with the workload. Figure 5 shows them for our caching RPC server. The left y-axis of the graph shows that memory overhead decreases linearly as the GOGC value is reduced, while the right y-axis shows that garbage collection frequency increases exponentially. (This happens because each halving of the memory overhead requires that garbage collection is run twice as often.) Note that while we measure garbage collection frequency here, we do so only as a proxy for the CPU usage, which is what we ultimately care about.
We can use this graph of the two overheads to reason about their tradeoff. For example, if we wanted to reduce the memory overhead from 100% to 10%, that would require increasing the garbage collection frequency by over 5x, from 0.77 cycles/s to 6.0 cycles/s. It’s common for Go programs to use 1–10% of their CPU time on garbage collection, so a 5x increase could cause garbage collection to use an enormous portion (up to 50%) of a process’s available CPU time. A more moderate halving of the memory overhead would double the garbage collection frequency, to 1.3 cycles/s (up to 20% CPU time). Overall, tuning GOGC can slightly reduce the memory overhead for certain programs, but the cost reduction opportunity is limited by the quickly increasing CPU overhead.
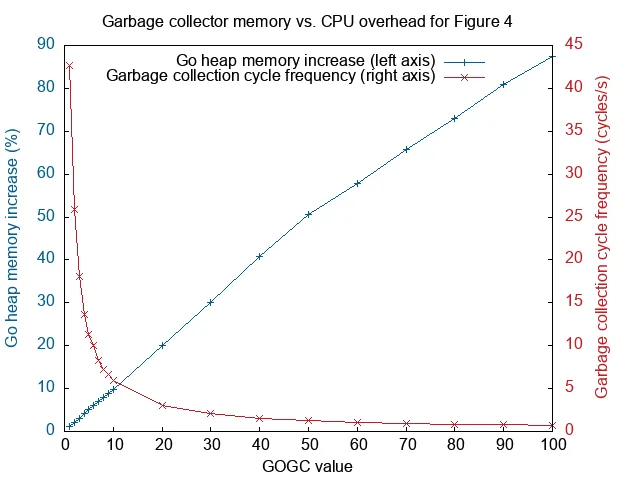
Figure 5: The impact of the Go garbage collector’s target percentage on its memory overhead (left y-axis) and CPU overhead (right y-axis) for the program shown in Figure 4. For both y- axes, lower values are better (more efficient).
Eliminating the memory overhead
The second method we’ll describe eliminates — rather than just reduces — the garbage collector’s memory overhead for specific use cases.
The garbage collector incurs its memory overhead only for the memory it manages (the memory that makes up the Go heap). Since Go code has access to all memory in the address space, not just the Go heap, we can eliminate the garbage collector’s memory overhead for specific objects by managing their memory outside of the Go heap. One way to do this is through the kernel’s memory API, using the mmap family of system calls via the Go syscall package. (Another way is through C’s heap API, using the malloc family of calls via Cgo. There can be performance differences between these two APIs, but we won’t cover them in this article.) Memory outside of the Go heap is read from and written to in the same way as memory inside the Go heap. The difference, for the purpose of memory overhead, is that the garbage collector ignores the memory that’s not in the Go heap.
We can look at the address space of a Go process to see how the Go garbage collector knows which memory it’s responsible for. Figure 6 shows a sketch of the address space of a Go process that has allocated memory from the Go heap and memory for a cache from the kernel (via the mmap system call). Go’s heap is composed of regions of memory Go calls “arenas.” A Go process has a global variable, “mheap,” that contains an array large enough to reference every possible arena in the address space. Armed with the mheap global variable, the garbage collector is able to identify every region of memory that makes up the Go heap. (For additional details, see Go’s runtime/mheap.go and Deepu Sasidharan’s article on the data structures for memory management in Go.)
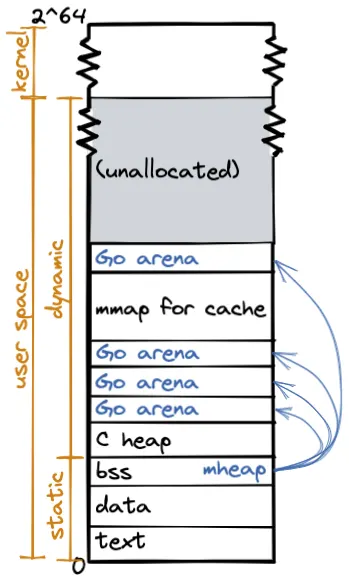
Figure 6: Address space layout of a 64-bit Go program with its cache allocated from the kernel. “Go arena” regions make up the Go heap. “mheap” is a global variable with a static address that references all of the Go arenas. The garbage collector uses it to track the Go heap. The “mmap for cache” region was allocated directly from the kernel. It is not referenced by mheap and therefore is not managed as part of the Go heap.
A limitation to be aware of is this technique is easiest to use for memory that does not contain pointers into the Go heap. The garbage collector ignores any external pointers, and will garbage collect heap objects without checking whether they’re referenced by objects outside the heap. This hasn’t been an issue for us, as we’re caching self-contained chunks of data.
The main complication introduced by bypassing the Go heap is the shift of responsibility for memory deallocation from the Go runtime to the programmer. We’ll describe two approaches to managing deallocations.
A simple approach to deallocating this memory is to write explicit deallocation code, e.g. calling syscall.Munmap for memory allocated by syscall.Mmap. This can be straightforward in small systems and can work well. Figure 7 shows how this can be done, by extending the caching RPC server to allocate the cache memory from the kernel rather than from the Go heap. This reduces the amount of memory the process uses from 2,248 MiB to 1,162 MiB (a 48% reduction), as measured from the Linux process status file. At the level of the Go heap, the gctrace output shows that the size of the garbage collection goal is reduced from about 2,200 MiB to about 130 MiB. These match our expectations, since the 1,024 MiB of cache data was moved out of the Go heap and the primary remaining memory in the Go heap is the 64 MiB of request data.
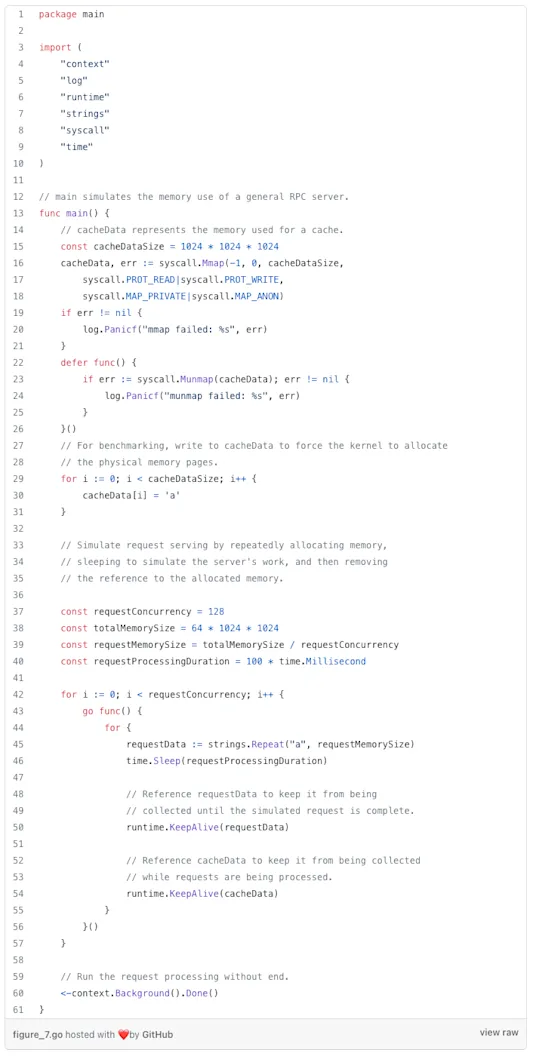
Figure 7: The caching RPC server from Figure 4, modified to allocate the memory for the cache from the kernel rather than from the Go heap. (The changes are to lines 16–31.)
In larger systems, the code to perform explicit deallocation can become more complicated. For example, if memory is allocated in a module that transfers the responsibility for the memory to other modules, those other modules must ensure that they deallocate that memory. This pattern of explicitly releasing resources is uncommon in Go, which further increases the chances that some modules will forget to do so. Further, there may not be a clear single owner for each object, which may necessitate the use of additional runtime machinery to track the object’s liveness (e.g., reference counting). Both of these complexities were issues for us at Samsara.
Where it would be complicated to explicitly deallocate memory, another approach is to automate what’s often the main source of complexity: determining when an object is no longer referenced. Here, we can leverage the garbage collector by allocating a (small) wrapper object from the Go heap for each external allocation, and having code always access the external memory through the wrapper object. Since the Go garbage collector will automatically deallocate the wrapper object when it becomes unreachable, we can register a finalizer on the wrapper object to deallocate the external memory. This approach lets a system confine all the memory management logic to just the code that allocates memory, avoiding the need to modify all code that uses that memory. We’ve found that this isolation has been a significant win at Samsara, because it lets us work in the rest of the system without having to reason about the management of an external heap.
We would be wary to recommend the use of Go finalizers without noting that they come with a list of caveats that is long and complex. For example, there’s no direct guarantee that Go will ever run a finalizer for an unreferenced object: a finalizer is run only when the garbage collector decides to free that object, which is based solely on the behavior of the Go heap. This said, we’ve found that when the use of finalizers is simple, they can be reasoned about robustly and put to good use in practice. Notably, the Go runtime itself makes use of finalizers — here’s a list of uses. (The full documentation for finalizers is a great read. Additionally, two useful blog posts on some of the difficulties that can come up with finalizers are available from Vincent Blanchon and David Crawshaw.)
Conclusion
Garbage collection probably is not the first thing you worry about when writing a Go application, but knowing how it works can come in handy. This is especially likely if you find your application uses a significantly higher memory to CPU ratio than your underlying hardware provides. In this blog post, we’ve covered:
Why the Go heap incurs a 100% memory overhead and how to observe it in action
How to assess whether this overhead is a significant issue for your application
How to reduce the memory overhead by adjusting the memory vs. CPU overhead in Go
How to eliminate the memory overhead without increasing the CPU overhead, by managing memory outside of the Go heap for specialized use cases
By eliminating the memory overhead for cached time series data, we reduced the operational costs for serving that data by 33%.
We hope this post has added to your understanding of how the Go runtime works with your applications, and that some of the techniques here might help you to reduce your own system costs. In general, we’ve found that understanding how your systems use limited resources can help you identify problems, decide which problems to solve, and decide how to solve them. Garbage collection in Go was just the starting point for optimizing our caching systems at Samsara, and in parts 2 and 3 of this blog series we’ll explain where our investigations took us next (moving data from RAM to SSD and optimizing data structures) and how together these changes reduced the operational costs for serving our time series data by over 95%.
If these types of problems sound exciting to you, we’re hiring for many engineering roles at Samsara and would love to hear from you. You can see our open positions here.
Special thanks to Zach Dylag, Kavya Joshi, and Kelly Koskelin for their contributions to this post.
Read more

Building the First Industrial-Grade Asset Tag at Samsara

VP of Product & Engineering


How Samsara India’s R&D Team Will Transform Physical Operations and Your Career

VP of Engineering & India Site Lead


Improving CI/CD with a Focus on Developer Velocity

Senior Software Engineer