
At Samsara, we make vehicle gateways that provide real-time vehicle telemetry from the engine computer over CAN, data from wireless temperature sensors over Bluetooth Low Energy, and Wi-Fi connectivity. The gateways are resource-constrained computers. Unlike a server with 16GB of RAM, or an iPhone with 4GB, our gateways have only 170MB and one core.
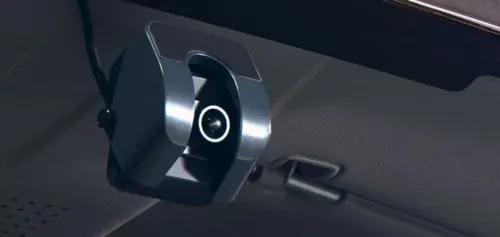
The new CM11 dash cam mounted in a vehicle
Earlier this year, we introduced an in-vehicle dashboard-mounted camera to help customers improve the safety of their fleets. The dash cam is a resource-intensive peripheral attached to the gateway. It records 1080p H.264 video at 30 frames per second.
Our initial camera management service, which is a process that runs on the gateway, used 60MB, nearly half of our total memory available on the gateway, but we knew we could do better. We were only buffering 3 seconds of 5Mbps video, but 60MB was enough to hold 90 seconds of video, so we looked to see where we could trim the memory usage down.
Building a camera management service
The camera management service sets the recording parameters for the camera, then receives and persists the video. The persisted H.264 video is converted to an mp4 for uploading to the cloud, which happens at a later time.
We chose to write the camera management service entirely in Go to integrate with the rest of our system. This made initial development quick and easy, but the service used nearly half the available memory on the gateway and began to cause Out of Memory kernel panics. Our goals were to: (1) keep the camera management process’ Resident Set Size (RSS) at 15MB or less to allow the other services on the gateway to run properly, and (2) leave at least 20% of total memory free to allow for periodic spikes in memory usage.
Tuning the buffer size
Our first effort to reduce memory use was to simply buffer less video in memory. Since we originally buffered 3 seconds of video at a time, we tried no buffering and wrote one frame at a time to disk. That approach didn’t work since the overhead of 20 KB writes (average frame size) at 30 frames per second (frame rate) lowered throughput and increased latency to a point where we couldn’t keep up with new frames coming in.
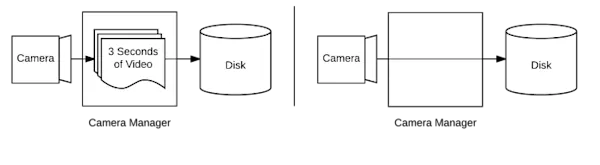
On the left is the original buffering architecture: we buffered roughly 90 frames of video before writing to disk. On the right is the no buffering architecture: we wrote each frame directly to disk.
Our next approach was to buffer by a fixed number of bytes instead. We took advantage of Go’s extensive IO library and used the bufio.Writer module, which provides buffered writing to any io.Writer even if the underlying structure doesn’t support buffered writing. This let us specify how many bytes to buffer.
The next challenge was to determine the optimal tradeoff between buffer size and IO wait time. Too big of a buffer and we might use too much memory, but on the other hand, too long of an IO wait time and we would be unable to keep up with the video from the camera. We ran a simple benchmark that varied the buffer size between 1KB and 1MB and measured the time taken to write 3 seconds (or around 1.8 MB) of video to disk.
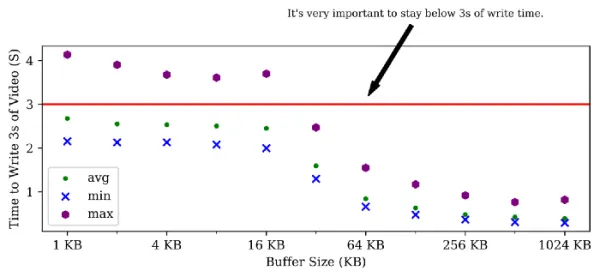
Buffer Size vs. Write Time
From the graph, there is an inflection point right at 64 KB — a nice size that doesn’t use too much memory to buffer and is fast enough to not result in video frames being dropped. (The implementation of flash storage in the drive caused this dramatic shift.) This reduction in buffering brought down memory usage by the order of megabytes, but not below our desired threshold.
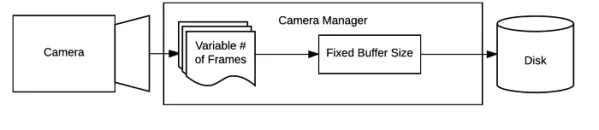
Final Architecture: we always buffer 64KB before writing.
The next step was to profile the camera management process’ memory usage using pprof, Go’s built-in profiler. We learned actual heap usage was very low, so we figured something suspicious was happening with the garbage collector.
Tuning the garbage collector
Go’s garbage collector prioritizes low latency and simplicity, It has a single parameter, GOGC, a percentage that controls total heap size relative to the reachable heap size. We tried varying this parameter, but it had no effect on the resident set size, since memory freed by garbage collection is not necessarily returned to the operating system right away.
After inspecting the source code, we learned the garbage collector only returns memory pages that are unused for at least 5 minutes back to the OS. As that avoids the allocate-free cycle that could otherwise happen on repeatedly creating and destroying large buffers, this is good for latency. However, this is not ideal for memory-sensitive uses like ours. Our use-case is not very latency-sensitive, and we’d rather trade higher latency for lower memory use.
The timeout for returning pages to the OS cannot be configured to be different, but the Go runtime library provides a function, debug.FreeOSMemory, to invoke the garbage collector and return unused memory to the OS on-demand. This was convenient. We modified the camera management service to call the function once every 5 seconds and saw the process’ RSS shrink down by ~5x to a reasonable 10–15 MB! The reduction in memory use doesn’t come for free, of course, but it works for us because we do not require real-time guarantees and can take the latency hit from more frequent GC pauses.
If you’re wondering why this helps: we upload video to the cloud periodically, which causes ~15MB spikes in memory usage. We can handle these spikes no problem, if they last for a few seconds, but longer spikes can cause a problem. A spike up to 30MB and the default GOGC value of 200% means the garbage collector can allocate up to 60MB. After the spike, Go doesn’t return the memory to the OS for 5 minutes, but by calling debug.FreeOSMemory, we’re able to make it do so within 5 seconds.
Summary
Introducing a new peripheral that was controlled by the gateway caused us to hit the gateway’s memory limits. We experimented with different buffering strategies to reduce memory use, but what ultimately helped was configuring Go’s garbage collector to a different behavior. This came as a surprise to us — the default for development in Go is to not think about memory allocation and collection, but the needs and constraints of our application are specialized enough to call for it. We were able to cut down memory use by a sweet 5x and ensure the gateway maintained the 50MB of free RAM needed while supporting video uploads.
Interested in working on projects like this? We’re hiring! Check out our available open positions.
Read more

Building the First Industrial-Grade Asset Tag at Samsara

VP of Product & Engineering


How Samsara India’s R&D Team Will Transform Physical Operations and Your Career

VP of Engineering & India Site Lead


Improving CI/CD with a Focus on Developer Velocity

Senior Software Engineer