Data Insights
Urban Exodus? Commercial Transportation Data Shows Shift from Bigger to Smaller Cities
October 21, 2020

Get the latest from Samsara
Subscribe nowPeople leaving major cities in favor of suburbs and smaller cities has been a topic of conversation for years. While reports differ on whether this is an ongoing trend or if COVID-19 has sparked a new urban exodus, many have noted that the pandemic could be an accelerating factor for this overall phenomenon.
We decided to study this trend through a different lens: commercial transportation data. Samsara’s 15,000+ customers have taken more than 48 million trips to and from America’s <a href="#methodology">200 largest cities</a> in the past year. We looked at data from three industries that closely reflect consumer mobility—food and beverage, wholesale and retail, and transportation and warehousing—to see which cities have experienced a decrease or increase in activity.
Read on to see what we found, including where commercial transportation activity was declining before COVID-19 started, which cities have been impacted the most by the pandemic, and which cities might be up-and-coming hubs of commercial transportation.
Key findings
For this analysis, we compared trip share per month from September 2019 to September 2020 for the <a href="#methodology">top 200 cities in the U.S. by population and population density</a>. Trip share is the ratio of trips that occurred in a given city compared to the total number of trips that occurred in all cities we analyzed. Analyzing trip share allowed us to normalize for any overall spikes or dips in total U.S. commercial transportation activity, and isolate each city’s specific trend. For more details on how we conducted this analysis, see our <a href="#methodology">methodology</a>. Here’s what we found:
Trip share has
<a href="#overall-trend">shifted from bigger to smaller cities</a>over the last year. Even before the COVID-19 pandemic hit, overall trip share for America’s top 25 cities was declining. At the low point in April 2020, big cities saw a 9% decrease in trip share compared to September 2019, whereas small cities saw a 6% increase.Los Angeles, CA, Baltimore, MD, and San Diego, CA are among the
<a href="#cities-with-large-declines">cities with the most significant declines in trip share</a>. For example, Baltimore saw a 43% decrease in trip share, comparing September 2020 to September 2019.Savannah, GA, Jacksonville, FL, and Greensboro, NC are among the
<a href="#cities-with-large-increases">cities with the most significant increases in trip share</a>. For example, Savannah saw a nearly 200% increase in trip share, comparing September 2020 to September 2019.The COVID-19 pandemic has
<a href="#covid-19-effect">accelerated this trend for some cities</a>. When COVID-19 first hit the U.S. around February and March, some cities saw sudden changes in trip share. For example, San Francisco, CA saw a 37% decrease in trip share from February to April 2020, whereas Sacramento, CA saw a 20% increase over the same time period.
<div id="overall-trend">Trip share has shifted from bigger to smaller cities</div>
To analyze the overall trend, we started by comparing trip share for two groups: bigger cities (the top 25 cities on our <a href="#methodology">list of America's 200 largest cities</a>, which is determined by population and population density) and smaller cities (the other 175 cities on the list).
The chart below shows trip share for these two groups, benchmarked against September 2019 as a baseline. As you can see, overall trip share for America’s top 25 cities has been declining over the past year—even before the COVID-19 pandemic hit. This is mirrored by an increase in trip share for smaller cities. At the low point in April 2020, big cities on average saw a 9% decrease in trip share compared to the baseline of September 2019, whereas small cities on average saw a 6% increase.
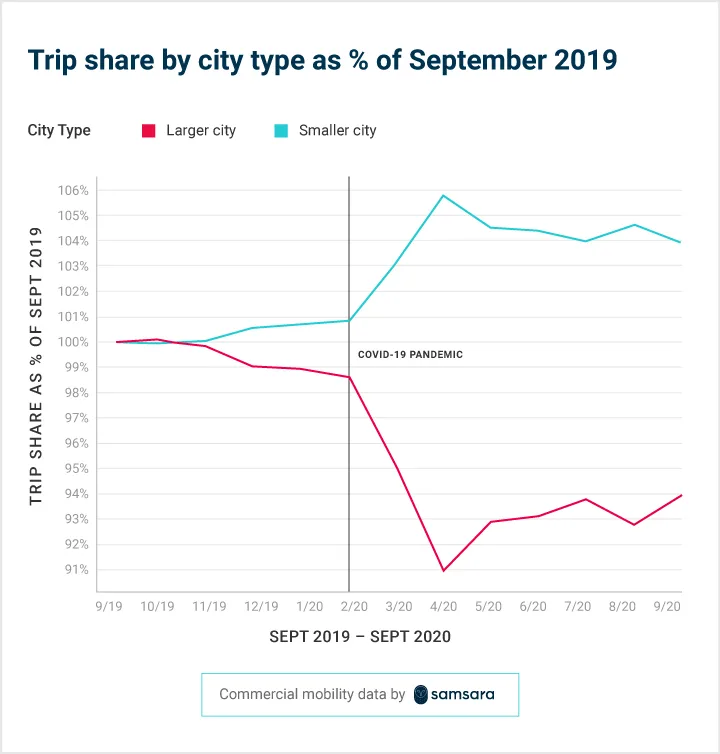
This trend could be due to a combination of factors, including the increasing cost of living in big cities, traffic congestion, or the emergence of new, smaller city hubs due to private sector activity, like a large company opening a new office.
We can also see that this trend was exacerbated by the COVID-19 pandemic. In the chart above, the vertical line denotes February 2020, when COVID-19 first started impacting the United States. Bigger cities saw a steep decline in trip share around this time. On the whole, bigger cities are starting to recover from this sudden decline. However, <a href="#covid-19-effect">some cities were more affected by COVID-19</a> than others, which we’ll discuss more below.
<div id="cities-with-large-declines">Big cities saw large declines in trip share over the past year</div>
Which areas were most affected by this trend? Below are cities that saw significant declines in trip share over the past year—all relatively well-populated cities, mirroring the overall trend.
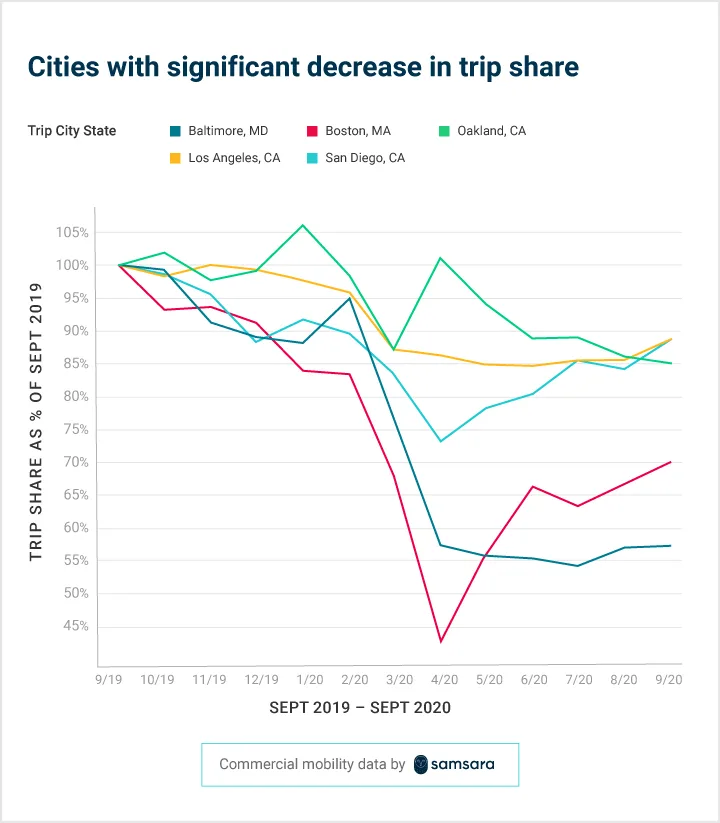
Comparing September 2020 to September 2019:
Baltimore, MD saw a 43% decrease in trip share. Baltimore’s population has been declining for years, and U.S. Census estimates released in March show the city's population dipped below 600,000 for the first time in more than a century. Fewer people could mean less need for transportation of commercial goods into and out of the city.
Boston, MA saw a 30% decrease in trip share. It was already on a downward trend before COVID-19 hit. Since then, it has plummeted, only recovering slightly since April 2020. This could partially be due to the recent exodus of renters from Boston; there has been a 7% to 9% increase in empty apartments since COVID-19 hit.
Oakland, CA saw a 15% decrease in trip share. Oakland is part of the San Francisco Bay Area, which saw a large population outflow in 2020 compared to 2019.
Los Angeles, CA saw a 12% decrease in trip share. Los Angeles remains among the cities with the highest unemployment rates since COVID-19. The city’s leisure and hospitality industry was hit hard by job declines, losing 11,800 positions.
San Diego, CA saw a 12% decrease in trip share. Similar to the San Francisco Bay Area, reports also indicate that San Diego has seen a large population outflow. From 2012 to 2017, the city saw the fourth largest net migration loss among major metro areas; the report noted this could be due to millennials moving to more affordable cities.
Interestingly, three of these cities with significant declines in trip share—Los Angeles, Oakland, and San Diego—are in the state of California. This could be due to the state’s strict COVID-19 restrictions, large decrease in tourism (and the resulting high unemployment rate), or other factors.
<div id="cities-with-large-increases">Smaller cities saw large increases in trip share over the past year</div>
On the other hand, which cities saw significant increases in trip share? We found that smaller cities experienced the largest gains.
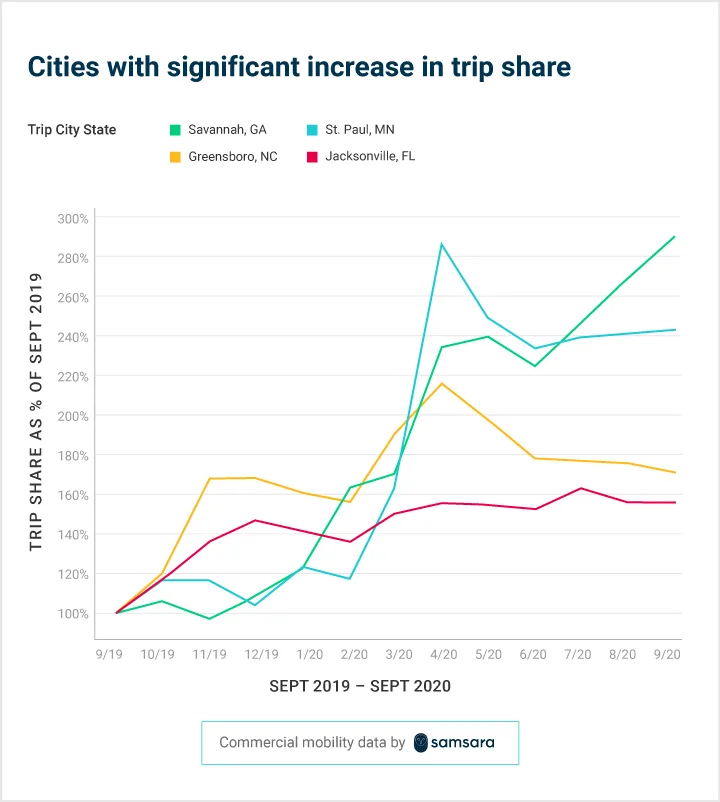
Comparing September 2020 to September 2019:
Savannah, GA saw a 190% increase in trip share. Interestingly, Savannah is a port city—and container volume in Savannah set a new monthly record in August. Increased container volume at the port could mean more frequent trucking and logistics trips to transport those goods.
St. Paul, MN saw a 140% increase in trip share. Minneapolis, the other Twin City, also saw a 195% increase in trip share. Most of Minnesota's population growth in the past decade has been concentrated in the Twin Cities. According to a report on U.S. Census Bureau data, the Twin City area’s population grew by about 9%, while the rest of Minnesota only saw a 3% increase.
Greensboro, NC saw a 70% increase in trip share. Over the past few years, the population growth rate in Greensboro has outpaced the national average due to the low cost of living and affordable housing.
Jacksonville, FL saw a 55% increase in trip share. According to a recent report from LinkedIn, Jacksonville has seen a large population inflow this year; from April to August 2020, the city saw 10.7% gain in net arrivals compared to last year.
Interestingly, each of these cities’ states lifted their COVID-19 stay at home orders in late April or early May. It’s possible that faster reopening could have led to increased trips, compared to other regions of the country that had a longer lockdown period.
<div id="covid-19-effect">For some cities, the COVID-19 pandemic has accelerated this trend</div>
Some cities were more affected by the COVID-19 pandemic than others. When COVID-19 first started impacting the United States in February 2020 and shelter-in-place orders first went into effect in March 2020, some cities saw a sudden decrease in trip share, whereas others saw a sharp increase.
In line with the broader trend, cities that saw significant decreases in trip share post-COVID are bigger, urban metropolises.
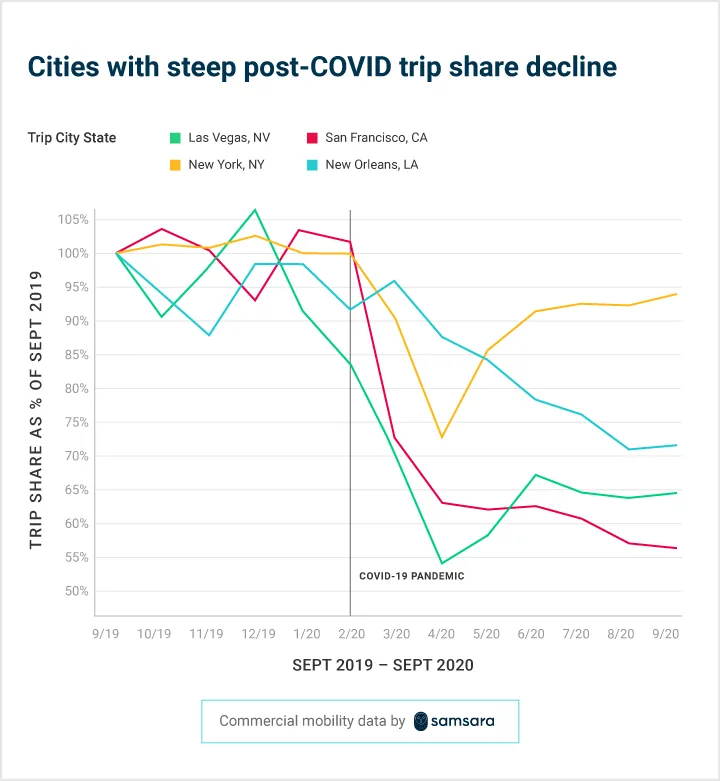
Comparing February to April 2020:
Las Vegas, NV saw a 45% decrease in trip share. This sharp decline is likely due to the city’s reliance on tourism and the fact that Las Vegas casinos are currently only operating at 50% capacity.
San Francisco, CA saw a 37% decrease in trip share. On average, monthly trip share was already declining in San Francisco before COVID-19 hit, and it has yet to recover from the sudden, severe dropoff in February. This could be due to San Francisco’s early shift to remote work (especially in the technology industry), or the city’s relatively strict lockdown rules.
New York, NY saw a 28% decrease in trip share. However, unlike San Francisco, monthly trip share was relatively stable in New York prior to COVID-19. The city saw a steep dropoff in February and March, unsurprising given it was a COVID-19 hotspot. However, it has almost completely recovered from the sudden dropoff in March—trip share increased 30% from April to September 2020 and is now back at around 95% of baseline. This rapid recovery in trip share could be influenced by the city’s quicker reopening plans and its role as a central shipping hub; the Port of New York and New Jersey is the East Coast’s largest port.
New Orleans, LA saw a small uptick in trip share from February to March, but then experienced a 25% decrease from March to September 2020. This could be explained by the fact that the city saw an explosion in COVID-19 cases in March and April, effectively halting commerce. Similar to Las Vegas, decreased tourism could also be a factor.
On the other hand, cities that saw significant increases in trip share post-COVID are smaller and have a lower cost of living.

Comparing February to April 2020:
Long Beach, CA saw a 22% increase in trip share. Long Beach is just outside of Los Angeles, which saw an 12% decrease in trip share over the same time period. Similar to Savannah, Long Beach is a port city, and there has been lots of chatter within the supply chain community about how port cities are bouncing back faster than anticipated post-COVID.
Sacramento, CA saw a 20% increase in trip share. Sacramento is about 90 miles from San Francisco, which saw an 37% decrease in trip share over the same time period. A recent report found that the COVID-19 pandemic is “fueling a new wave of Bay Area transplants to the Sacramento region,” which could help explain why trip share is increasing in Sacramento and decreasing in San Francisco.
Charlotte, NC saw a 20% increase in trip share. Charlotte is known as one of the most affordable “big” cities, and movement to Charlotte was already on the rise in early 2020. It’s possible that COVID-19 accelerated this existing trend, especially as residents of larger cities look for more affordable alternatives.
Interestingly, both Long Beach and Sacramento are geographically near bigger cities that saw large declines (San Francisco and Los Angeles). Furthermore, although Charlotte is a relatively large city, it is known for being relatively affordable. The post-COVID increase in these cities could indicate a shift to better cost of living.
De-urbanization could cause broader, long-lasting effects
All in all, our commercial transportation data supports other reports of an “urban exodus” that has been accelerated, for some cities, by COVID-19. This trend has been widely noted in the real estate industry, with reports on housing market data and moving company and rental market data showing similar findings. In fact, a recent analysis from LinkedIn on migration trends found that “hints of de-urbanization can be found across the country.” Mirroring our own city-specific findings, LinkedIn reported that big cities—including New York, the San Francisco Bay Area, and Boston—are seeing the steepest declines in net arrivals, while smaller cities—including Jacksonville and Sacramento—are seeing the largest gains.
If this de-urbanization trend continues, we may see effects beyond commercial transportation. It’s possible that the COVID-19 pandemic could spur a fundamental shift in our city landscape, which would likely trickle down to industries beyond commercial transportation, including hospitality, retail, and more. We’ll continue to keep tabs on these trends over the next year to see where and how new transportation hubs are popping up around the country.
Subscribe to our series for more data insights
Want more insights like this from Samsara? Get access to transportation trends as soon as they're released by subscribing to Samsara Data Insights.
Samsara collects more than 1.6 trillion sensor data points yearly from more than 15,000 customers across diverse industries—including transportation and logistics, construction, local government, and more. Our data science team analyzes this data to find insights you can use within your own fleet.
Subscribe now to get the latest insights delivered straight to your inbox.
Subscribe<div id="methodology">Methodology</div>
To build an understanding of commercial mobility in America’s cities, we looked at trips in the top 200 cities by population (according to census.gov) from September 2019 to September 2020. We limited our sample to customers in the food and beverage, wholesale and retail, and transportation and warehousing industries, as these are more directly related to consumer mobility.
Instead of raw trip numbers, which can overemphasize mobility trends in larger cities, we looked at trip share by city per month and tracked changes in that metric over time. Trip share is the ratio of trips that occurred in a given city compared to the total number of trips that occurred in all 200 cities we analyzed. For example, if Chicago had 100,000 trips in September 2019 and the total number of trips for the cities in our sample for September 2019 were 1 million, Chicago’s trip share would be 10%. We also aggregated the data by major cities vs. others.
The top 25 major cities were chosen by ranking America’s largest cities both in terms of population size and population density (list below).
New York City
Los Angeles
Chicago
Houston
Phoenix
Philadelphia
San Antonio
San Diego
Dallas
San Jose
Austin
Columbus
Charlotte
San Francisco
Seattle
Denver
Washington
Boston
El Paso
Detroit
Portland
Las Vegas
Baltimore
Milwaukee
Atlanta
We took a few additional measures to control for noise and confounders in the data. For example, we controlled for new customers joining the Samsara platform by fixing the sample to customers who had joined Samsara two months before the period we analyzed. We also only considered cities that had at least 1,000 trips for every month in the period and used regression techniques to identify cities with the highest increase, highest decrease, and most significant impact from COVID-19 in trip share.
Get the latest from Samsara
Subscribe nowRead more


The Samsara Year in Review report: A look back at your 2025

Sr. Director, Customer Marketing

Holiday Gift Guide for Frontline Workers

Head of Insights

America’s most dangerous winter roads
Head of Insights


Canada’s two seasons: Winter and construction
Head of Insights


AI reveals where and when American drivers are most distracted

Senior Data Scientist