Get the latest from Samsara
Subscribe nowFor many fleet managers, getting a handle on your asset utilization requires tedious data entry into endless spreadsheets with complicated (and finicky) formulas. This method of calculating utilization is not only error-prone, it’s time consuming. At Samsara, we believe in building tools that operations and logistics professionals really need which is why we’re excited to introduce the Utilization Report for asset tracking — a new report that tackles the tedium by giving real-time and reliable insights into how much your assets are being used.
Whether you’re currently right-sizing your fleet or just want a quick snapshot of your operations, having utilization data is key to growing an efficient business.
This latest report allows you to:
Save time and better allocate your powered assets
Make efficient informed business decisions when right-sizing your inventory
<a id="blog-inline-1" href="/pricing" title="Learn more about Samsara" class="btn primary-btn btn--blue">Learn more about Samsara</a>
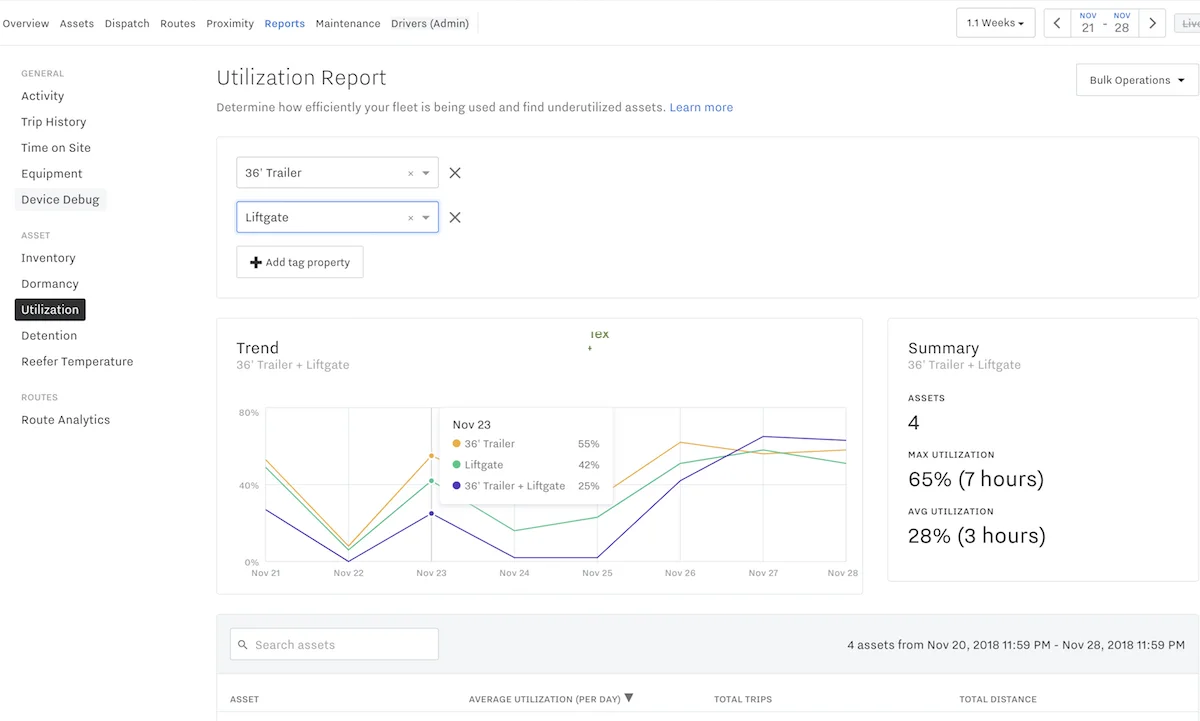
Calculating Real-Time Utilization
In order to get a clear picture of how your assets are being used our new report allows you to segment your assets by type or location, select a date range and get a percentage calculation of usage for those assets during that window. By default, we calculate utilization by looking at the number of hours that an asset was used during a 12-hour work day. You can also look at distance traveled by asset. For trailers this is particularly helpful for differentiating between true usage (miles covered by your asset) versus short yard-moves.
Fleet managers who use tags to designate different asset types (for example, differentiating dry van trailers and reefers, or tagging different types of construction equipment) can compare utilization across different subsets of their fleet. They also use tags to differentiate assets by location for immediate visibility into how efficient or inefficient different geographic areas of a business are performing.
Allocate Assets More Efficiently
By actively reporting and monitoring on utilization, fleet managers can improve operations by allocating assets more effectively. For example, imagine you are running a shipping business with multiple fleet groups arranged by region — you may compare two geographic fleet hubs and see that your northeast trailer group is functioning at an average of 40% weekly utilization during the winter months but the southwest group is at an average of 95% weekly utilization. Instead of simply buying more trailers for southwest to meet the growing demand, you can reallocate resources from the underutilized northeast group for a few months until demand evens out (and save money!)
Critically important to making these sorts of calculations and decisions is getting accurate data in real time. With the Utilization Report you can gather these insights immediately instead of hunting down and entering data manually for tens, hundreds, or even thousands of assets. If you need granular data on utilization, you can always export raw data from the report and manipulate it based on your business needs for hour-by-hour, asset specific insights. By relying on our real-time report your team will save hours wasted doing data entry, while still capturing the data critical to making informed operations decisions.
<a id="blog-inline-1" href="/pricing" title="Learn more about Samsara" class="btn primary-btn btn--blue">Learn more about Samsara</a>
Right Size with Confidence
Utilization data is critical to balancing your asset inventory and making informed decisions about your capital investments. With too many costly trailers (or other powered assets) on your books, you risk running unnecessary overhead costs. With too few, you could limit your company's growth. Achieving maximum efficiency with your assets ensures you’re set up to grow your business.
Whether your goals are to make immediate updates to your asset mix, reallocate assets in real time based on usage, or just better understand your day-to-day operations, the Utilization Report for powered assets is a powerful tool for managing your business.
If you are not yet a Samsara customer and would like to learn more, schedule a free demo!
<a id="blog-inline-1" href="/pricing" title="Learn more about Samsara" class="btn primary-btn btn--blue">Learn more about Samsara</a>
Get the latest from Samsara
Subscribe nowRead more


New innovations from Samsara help fleets find and recover the hidden operational costs

Director, Product Marketing


New AI-powered Weather Intelligence enhancements to improve safety for any season

Senior Product Marketing Manager

Introducing Samsara’s satellite solution: Connectivity, anywhere, anytime

Director, Strategic Markets Product Management and Hardware Product Manager

4 of Samsara’s Most Game-Changing New Releases of Spring 2023

Senior Customer Program Manager, Learning & Enablement

4 of Our Most Impactful Product Releases of 2022
Senior Customer Program Manager, Learning & Enablement