
Get the latest from Samsara
Subscribe nowWinter doesn’t just change how the roads look—it changes how they behave, turning seemingly safe pavement slick within seconds as temperatures drop faster than roads can adapt. In fact, winter weather contributes to nearly 20% of weather-related crashes nationwide, according to the Federal Highway Administration.
Consequences in the commercial space extend far beyond the sole vehicle or driver that’s part of the fleet. In crashes involving large trucks, about 70% of the people killed and roughly 72% of those injured are occupants of other civilian vehicles.
During the holiday and winter season, the risk to passenger-vehicle occupants further increases. Thanksgiving travel brought roughly 70 million people onto U.S. roads in 2024, and just a few weeks later, more than 100 million traveled by car around Christmas and New Year’s. This surge puts significantly more passenger vehicles in close proximity to heavy trucks.
Extended darkness during the winter months also play a role—nighttime fatal crash rates are 3x higher than daytime—and road surface conditions can deteriorate quickly as temperatures drop.
To understand how seasonal shifts translate into safety incidents and accidents, we analyzed anonymized operational data from Samsara’s Connected Operations Platform across 2022–2025. The results show a consistent pattern: crash risk increases in winter, independent of fleet size or industry. The conditions themselves introduce more exposure, meaning each mile driven in winter carries inherently higher risk than the same mile driven in spring or summer.
Seasonal breakdown: Crashes per mile climb in winter
Commercial drivers log more miles in spring than any other season, but those miles are statistically safer. In winter, the story shifts: Drivers travel slightly less, but experience about 7% more crashes per 1 million miles. That difference may seem small—but has large implications at scale. Here’s how this breaks down by season:
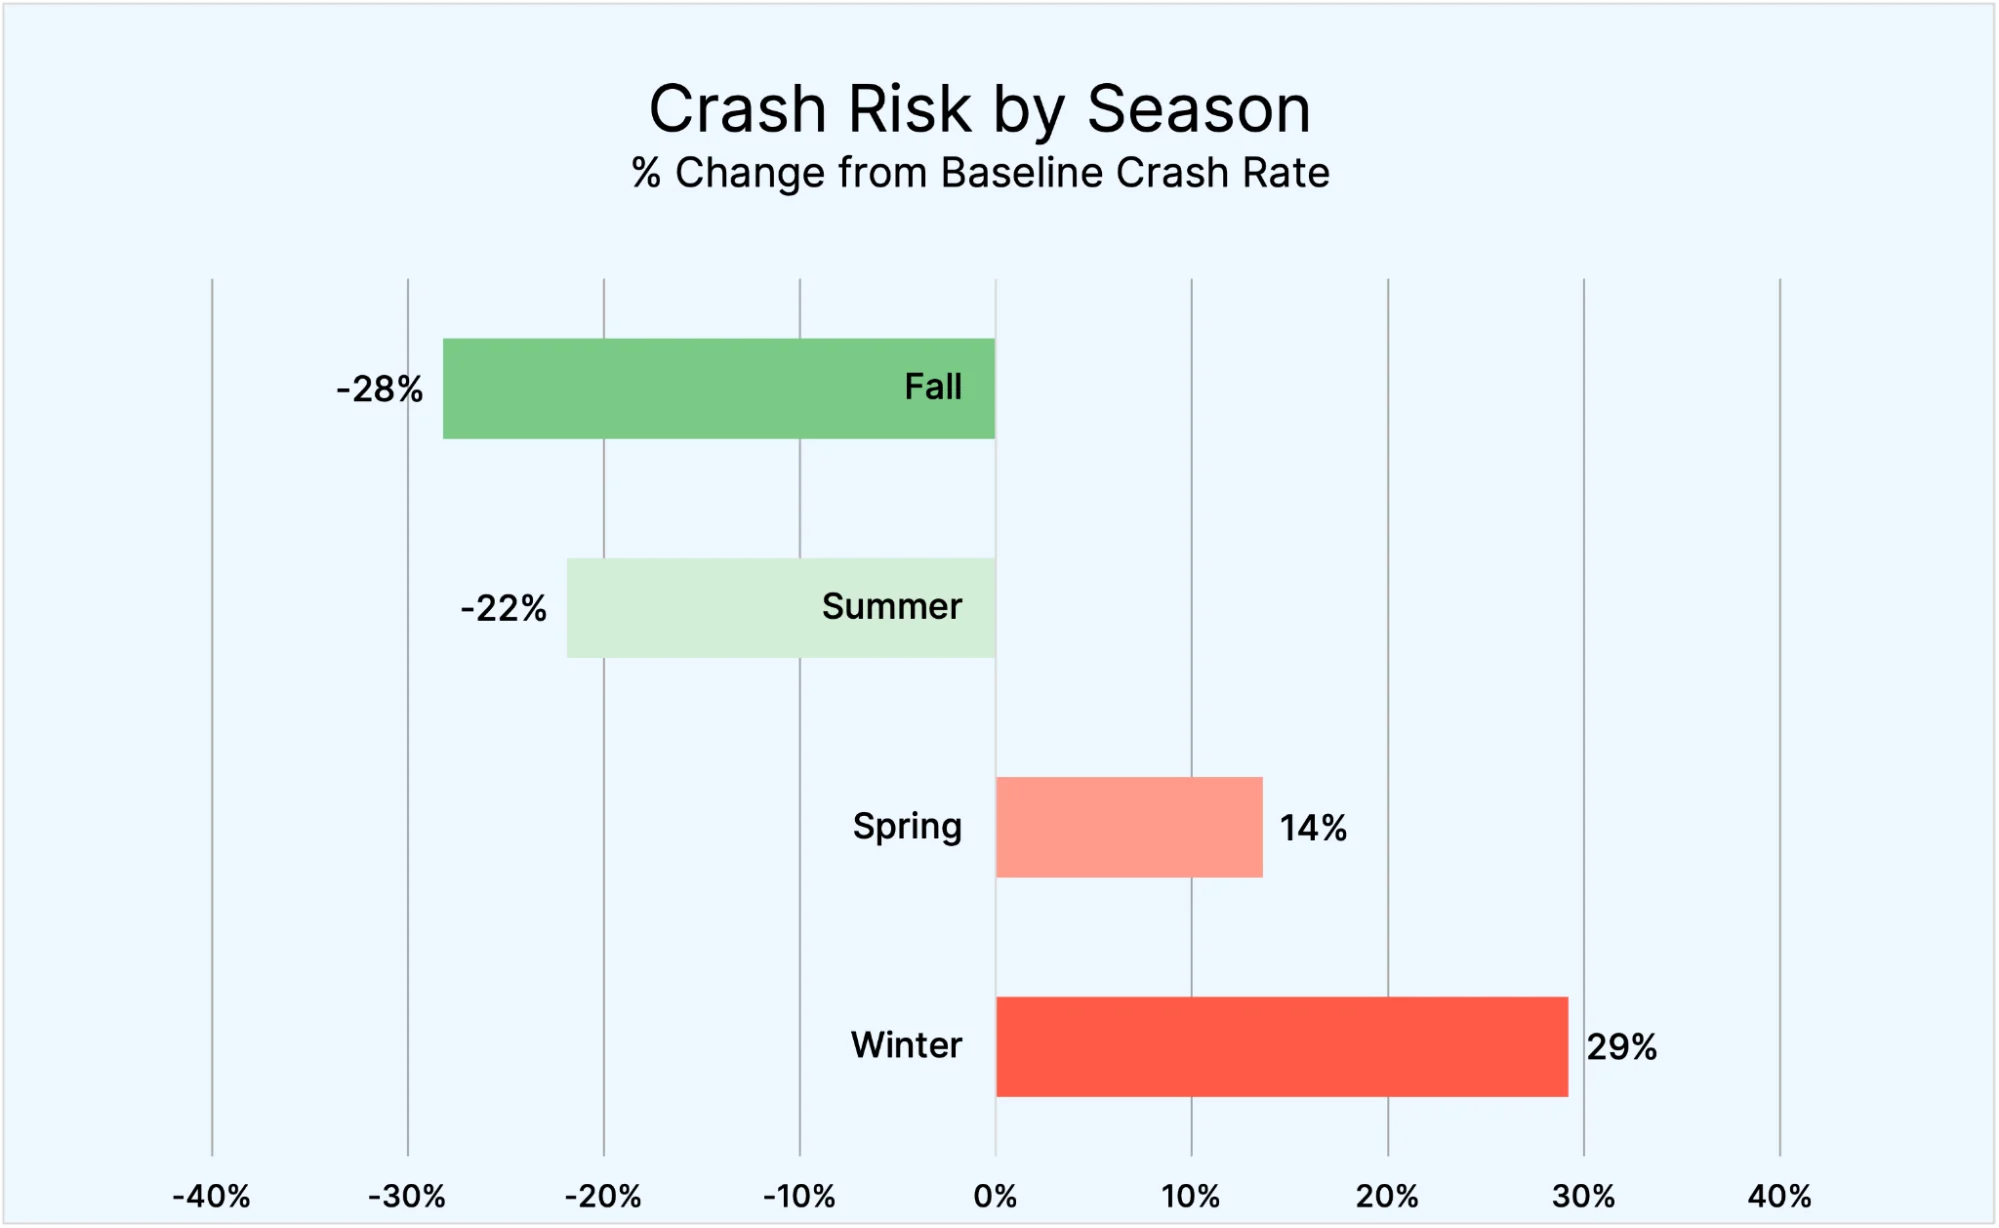
Season | Share of Miles Driven | Share of Crashes | % Change from Baseline Crash Rate |
|---|---|---|---|
Winter | 21% | 29% | 29% |
Spring | 25% | 30% | 14% |
Summer | 27% | 20% | -22% |
Fall | 27% | 22% | -28% |
In other words, winter risk isn’t about how much we drive, but how hazardous each mile becomes. The seasonal differences in crashes show how exposure and environmental severity interact differently across the year.
The winter holiday season
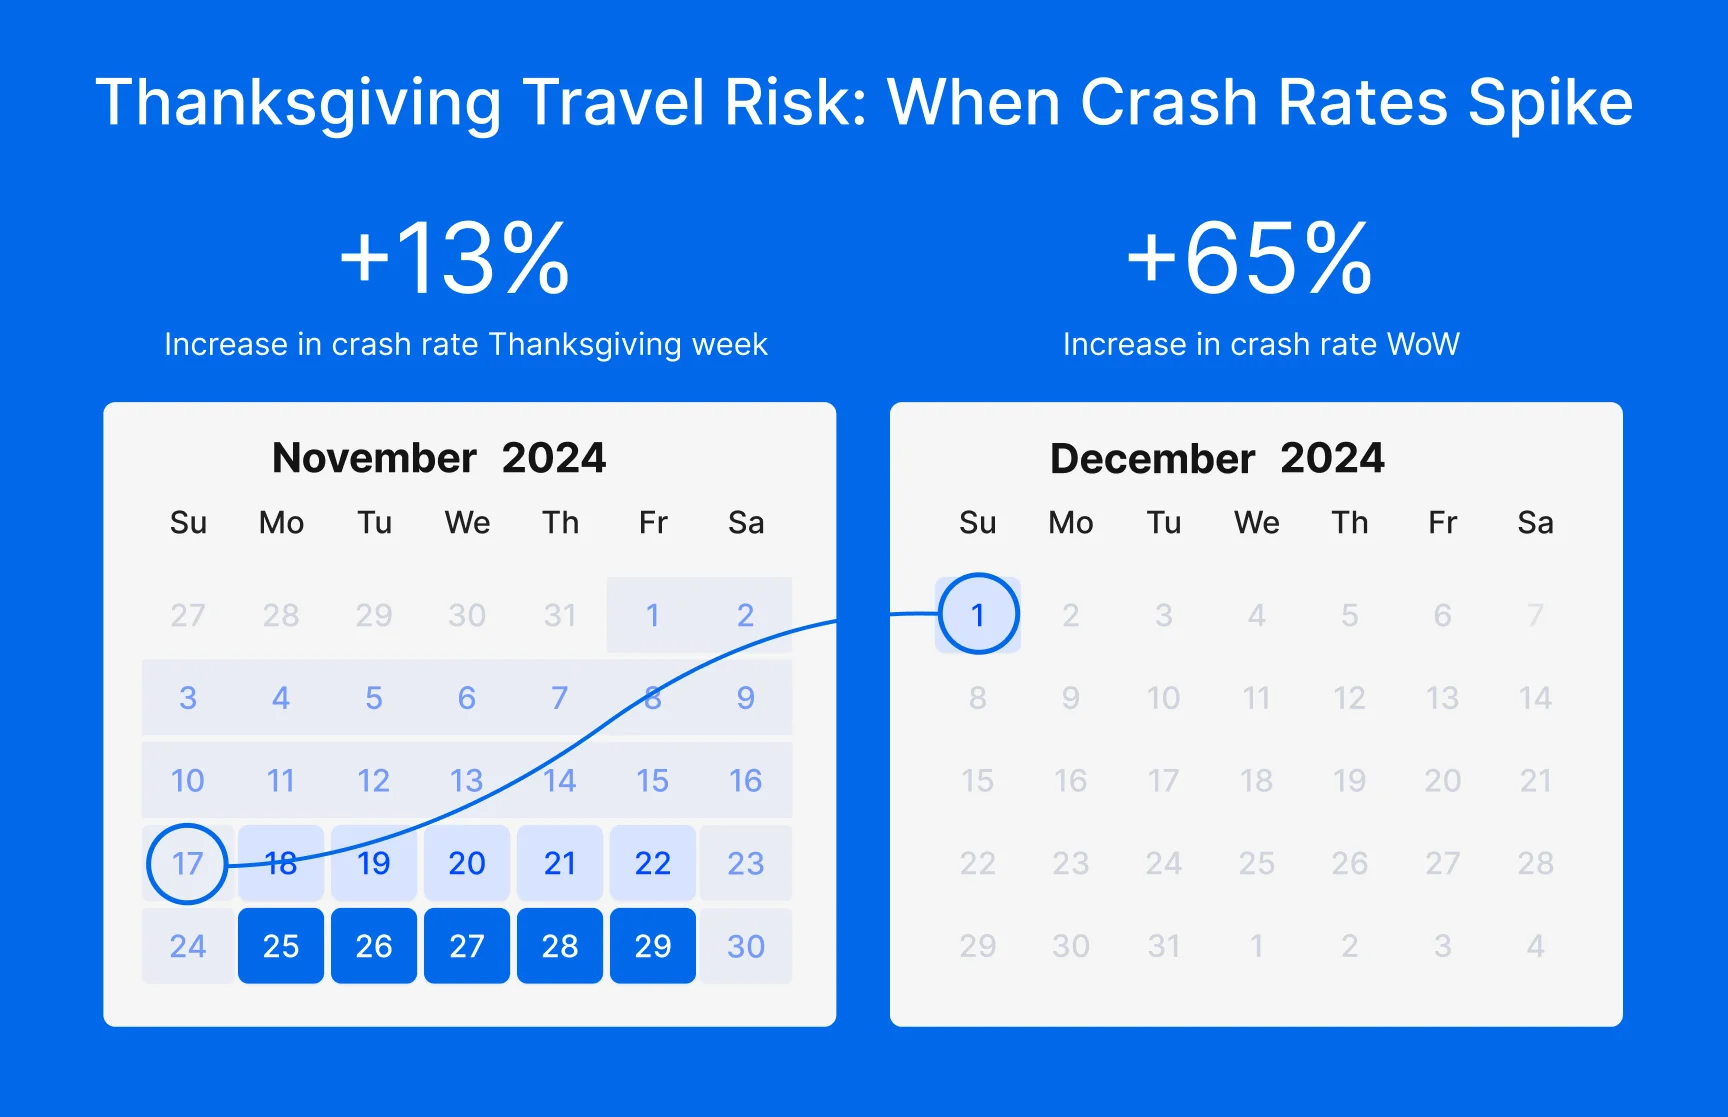
During the week of Thanksgiving, many shippers scale back operations and drivers take time off, reducing the number of trucks on the road and, correspondingly, lowering the total volume of commercial crashes that week.
But fewer commercial crashes doesn’t necessarily mean safer roads. Last Thanksgiving, as passenger vehicle volume surged during the holiday week, the commercial crash rate per mile rose 13%.
Thanksgiving Week vs. Prior Week (M–F 2024)
Period (M–F) | WoW Crash Volume Change | WoW Change (Rate) |
|---|---|---|
Week Prior (Nov 18–22) | — | — |
Thanksgiving Week (Nov 25–29) | –7% | +13% |
This culminated in a distinct spike on the Sunday after Thanksgiving (+65%), driven by the confluence of fleets ramping back up merging with the single busiest travel day of the year.
Return-to-Road Spike (Sunday, 2024)
Sunday | WoW Change (Rate) |
|---|---|
Nov 17 (baseline Sunday) | — |
Dec 1 (Sunday after Thanksgiving) | +65% (rate) |
When danger peaks
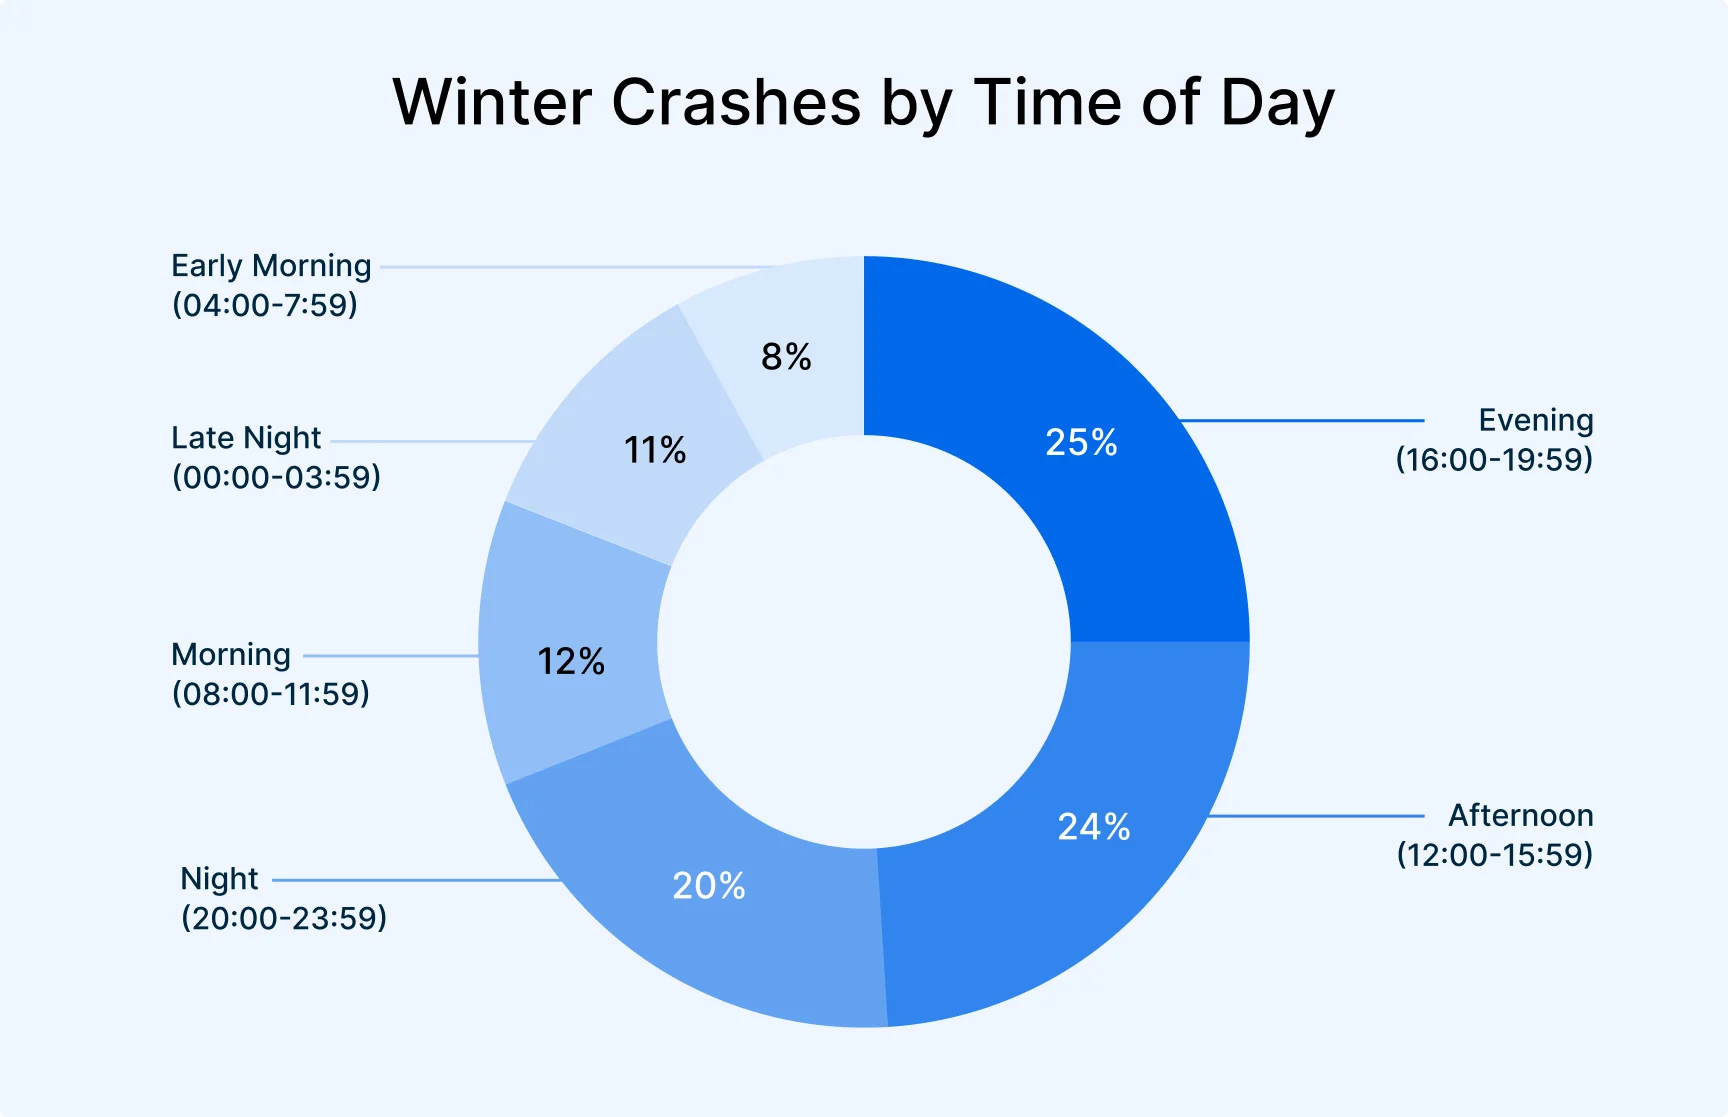
Winter crash risk is highest in the afternoon and evening commute windows, when together they account for nearly half of all crashes and traffic is heaviest. Congestion, changing pavement temperatures, and the transition from daylight to darkness combine to shrink reaction time. Nighttime hours remain especially risky as temperatures drop and visibility worsens, while late-night and early-morning periods still see serious crashes driven by fatigue and black ice.
Time of day | Crash share (Winter) | Key risk factors |
|---|---|---|
Afternoon (12:00–15:59) | 24% | Midday thaw/refreeze cycles, delivery traffic, variable pavement conditions |
Evening (PM Peak) (16:00–19:59) | 25% | Congestion, glare-to-darkness transition, mixed precipitation |
Night (20:00–23:59) | 20% | Full darkness, temperature drops, fatigue returning |
Morning (AM Peak) (08:00–11:59) | 12% | Commuter density, patchy refreeze lingering from overnight |
Late Night (00:00–03:59) | 11% | Limited visibility, black ice formation, fatigue |
Early Morning (04:00–07:59) | 8% | Frost formation, pre-commute freight activity, early low-sun visibility issues |
Top states for winter crash rate increases
Some states—such as Wyoming, New Mexico, and Montana—have elevated commercial crash rates year-round. However, winter conditions amplify crash risk most sharply in states where long-haul freight corridors intersect with rapidly changing weather conditions. From fall to winter, crash rates increased 168% in North Dakota, 65% in Mississippi, and 50% in Kentucky, with significant spikes also observed in Minnesota, Michigan, and Iowa. These states share a common pattern: high-speed rural or interstate roadways combined with early-season freeze and variable pavement conditions, which create abrupt exposure changes for commercial drivers.
Rank | State | Crash Rate Increase from Fall to Winter | Environmental Conditions |
|---|---|---|---|
1 | North Dakota | +168% | Rural freight corridors, extreme cold, limited lighting |
2 | Mississippi | +65% | Freeze–thaw precipitation, low-traction rural roads |
3 | Kentucky | +50% | Appalachian gradients, black ice on secondary highways |
4 | Minnesota | +44% | Long winter season, commuter exposure at dawn |
5 | North Carolina | +41% | Mixed precipitation, mountainous west vs. coastal rain |
6 | Michigan | +38% | Snowbelt exposure, multi-vehicle chain-reaction crashes |
7 | Iowa | +37% | Agricultural freight, icy crosswinds on plains |
8 | West Virginia | +35% | Narrow rural highways, rapid elevation changes |
9 | Nevada | +35% | Black-ice formation on desert highways overnight |
10 | Alaska | +29% | Extreme cold, limited daylight, small-miles denominator |
Geographical risk patterns shift dramatically—some small-mileage northern and rural states show rates 2–3x higher than national averages, even if their total crashes are modest.
High-population states (like Texas or California) dominate in absolute crashes.
Low-mileage, high-hazard states (like North Dakota or Minnesota) dominate in per-mile risk.
Regional patterns
Upper Midwest: North Dakota, Minnesota, Iowa, and Michigan show the steepest crash rate increases, tied to snowpack, ice storms, and heavy long-haul traffic.
Appalachia & South: Kentucky and Mississippi exhibit sharp rises due to intermittent freeze–thaw events and limited salting infrastructure.
West & Mountain States: Nevada and Colorado see rate gains linked to night-time black ice and high-altitude corridors.
Northeast: New York and Massachusetts show smaller but consistent winter upticks, offset by strong plowing and driver familiarity.
The most dangerous winter roads in America
Winter crash risk isn’t evenly spread across highways—it concentrates in a handful of brutal segments. The worst clusters show up on I-70 over Colorado’s high passes, I-80 across Elk Mountain in Wyoming, the Newark Bay stretch of the New Jersey Turnpike, I-40 at West Memphis over the Mississippi, and lake-effect and interchange zones on I-90 near Buffalo/Syracuse and I-80 through Des Moines.
What ties these hotspots together? Rapid temperature swings and wind exposure on elevation and bridges, plus dense metro interchanges where freight and passenger traffic coalesce—conditions that can strip pavement friction in minutes. In these heightened-risk environments, a small loss of traction or visibility can quickly escalate into multi-vehicle incidents involving both trucks and passenger cars.
Here are the U.S. roadways that show the largest increases in crash rate during winter, as compared to fall:
Rank | Roadway | State | Winter Crash Rate Increase | Top Hotspot Locations |
|---|---|---|---|---|
1 | I-80 | IA | 625% | Des Moines (Waukee / West Des Moines); Iowa City / Coralville; Council Bluffs to Omaha (Missouri River crossing) |
2 | I-80 | WY | 450% | Elk Mountain / Arlington; Laramie to Cheyenne; Rock Springs / Green River |
3 | I-40 | AR | 400% | West Memphis (I-55 crossing); Little Rock (I-30 / I-430); Russellville to Conway |
4 | Purple Heart Trail | AZ | 300% | Flagstaff (I-17 / I-40); Winslow to Holbrook; Kingman to Colorado River approach |
5 | Bordentown Turnpike | NJ | 288% | Bordentown / Crosswicks Creek |
6 | I-70 | CO | 267% | Eisenhower / Johnson Tunnels; Vail Pass to Silverthorne; Glenwood Canyon |
7 | I-57 | IL | 267% | South Chicago / Calumet; Effingham to Mattoon; Mt. Vernon to Marion |
8 | I-80 | NE | 263% | North Platte; Kearney to Grand Island; Lincoln to Omaha |
9 | New Jersey Turnpike | NJ | 230% | Newark Bay / Jersey City interchange zone |
10 | Dillard Highway | OR | 213% | Dillard / South Roseburg |
11 | I-94 | MI | 170% | Ann Arbor / Ypsilanti (US-23 access) |
12 | I-40 | NM | 156% | Gallup to Painted Desert; Grants to Continental Divide; East Albuquerque |
13 | I-85 | GA | 150% | Atlanta I-285 (“Spaghetti Junction”) |
14 | Indiana Toll Road | IN | 140% | South Bend / Mishawaka |
15 | I-75 | FL | 140% | Alligator Alley; Paynes Prairie (Micanopy fog zone); Tampa I-275 |
16 | I-44 | MO | 138% | Springfield metro interchange zone |
17 | I-70 | KS / MO | 133% | Kansas City Downtown Loop; Columbia to Kingdom City; Topeka to Junction City |
18 | I-95 | NC | 120% | Fayetteville merge zone; Rocky Mount to Wilson |
19 | I-90 | OH | 118% | Cleveland Innerbelt / Lake Erie shoreline; Lorain to Avon |
20 | I-90 | NY | 117% | Buffalo to Cheektowaga; Syracuse I-81 exchange; Albany river crossing approaches |
A connected approach to safer roads
Winter road conditions change faster than drivers can respond—pavement friction can drop within minutes as temperatures fall, and visibility declines earlier and more sharply. To balance out seasonal effects and operate a program anchored in safety, fleets need to shift incident response from reactive to preventative.
Increase real-time in-cab coaching: Use in-cab alerts to help drivers adjust in the moment when road or visibility changes occur.
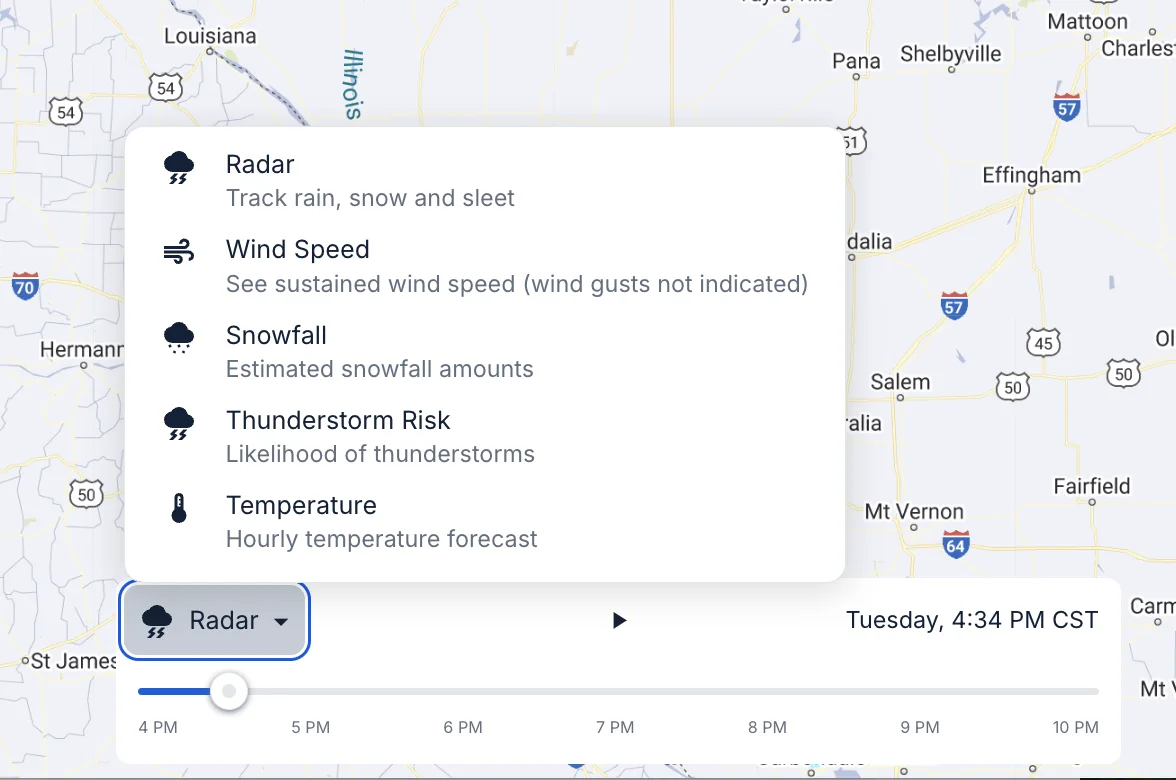
Continuously monitor weather and road conditions: Use Weather Intelligence and StreetSense to track changing conditions at the street level and alert drivers before they enter severe weather or black ice zones.
Expand visibility around the vehicle: AI dash cams and multi-cam setups provide 360-degree awareness, critical during longer dark hours and snow, rain, or fog.
Coach ahead of the risk curve: Samsara surfaces patterns in risky driving behavior so fleets can coach before these patterns escalate into incidents.
Proactively adjust operations: Use operational data to reroute, re-time trips, reduce schedules, or shift workloads when conditions deteriorate.
Seasonal solutions
Challenge | What changes in winter | Samsara solution |
|---|---|---|
Black ice is invisible until it's too late | Surfaces freeze faster overnight and in shaded highway segments. | Weather Intelligence highlights freeze risk zones and pushes alerts before drivers reach them. |
Crash risk spikes between midnight and 4 a.m. | Fatigue + impaired visibility + rapidly falling temperatures. | StreetSense™ and telematics identify which night routes and segments show the greatest risk, enabling route/time adjustments. |
Risk varies even within a single city or county | Elevation, microclimates, salt coverage, and wind exposure differ by road. | StreetSense™ provides segment-level scoring so fleets prioritize mitigation where it matters most, not systemwide. |
Not all drivers respond the same way to conditions | Coaching is often too generic or delivered too late. | In-cab AI delivers real-time alerts and adaptive coaching during conditions, not after. |
Moving from awareness to preventative action
Taking the following actions produces a step-change in how organizations manage winter operations:
Identify high-risk roadways and corridors using segment-level StreetSense™ scoring
Re-route or re-time trips based on Weather Intelligence forecasts
Real-time in-cab coaching for drivers most exposed to night or freeze conditions
Trigger operational changes (pretreatment, chain-up protocols, shift adjustments) before conditions cross thresholds
The result is not just fewer crashes, but fewer delays, fewer emergency responses, fewer claims, and fewer out-of-service vehicles when fleets are needed most. Understanding these patterns, and acting on them before exposure, is what truly reduces winter risk at scale.
To learn more about how Samsara safeguards against winter weather risks, visit Samsara's Weather Intelligence.
Get the latest from Samsara
Subscribe nowRead more


The Samsara Year in Review report: A look back at your 2025

Sr. Director, Customer Marketing

Holiday Gift Guide for Frontline Workers

Head of Insights


Canada’s two seasons: Winter and construction
Head of Insights


AI reveals where and when American drivers are most distracted

Senior Data Scientist