Data Insights
The real peak season for HVAC? It’s not when you think
August 6, 2025
Head of Insights

Get the latest from Samsara
Subscribe nowEvery summer seems hotter than the last—and with it, the need to cool down. Across the U.S., average temperatures are climbing, heat waves are lasting longer, and electrical grids are under increasing stress. For homeowners and businesses, that often means one thing: calling in the HVAC pros.
To understand how demand for HVAC services is rising—and when and where it spikes—we turned to one of the most grounded indicators out there: the drive time of HVAC technicians. Samsara analyzed a cohort of 65 million HVAC service trips across the United States from September 2023 to June 2025, drawing on over 14 trillion annual data points from real-world operations to reveal trip volume, mileage, and time logged getting to jobs.
The results reveal clear seasonal surges, regional hotspots, and one surprising peak month.
Let’s dig in.
The summer build-up—with a twist
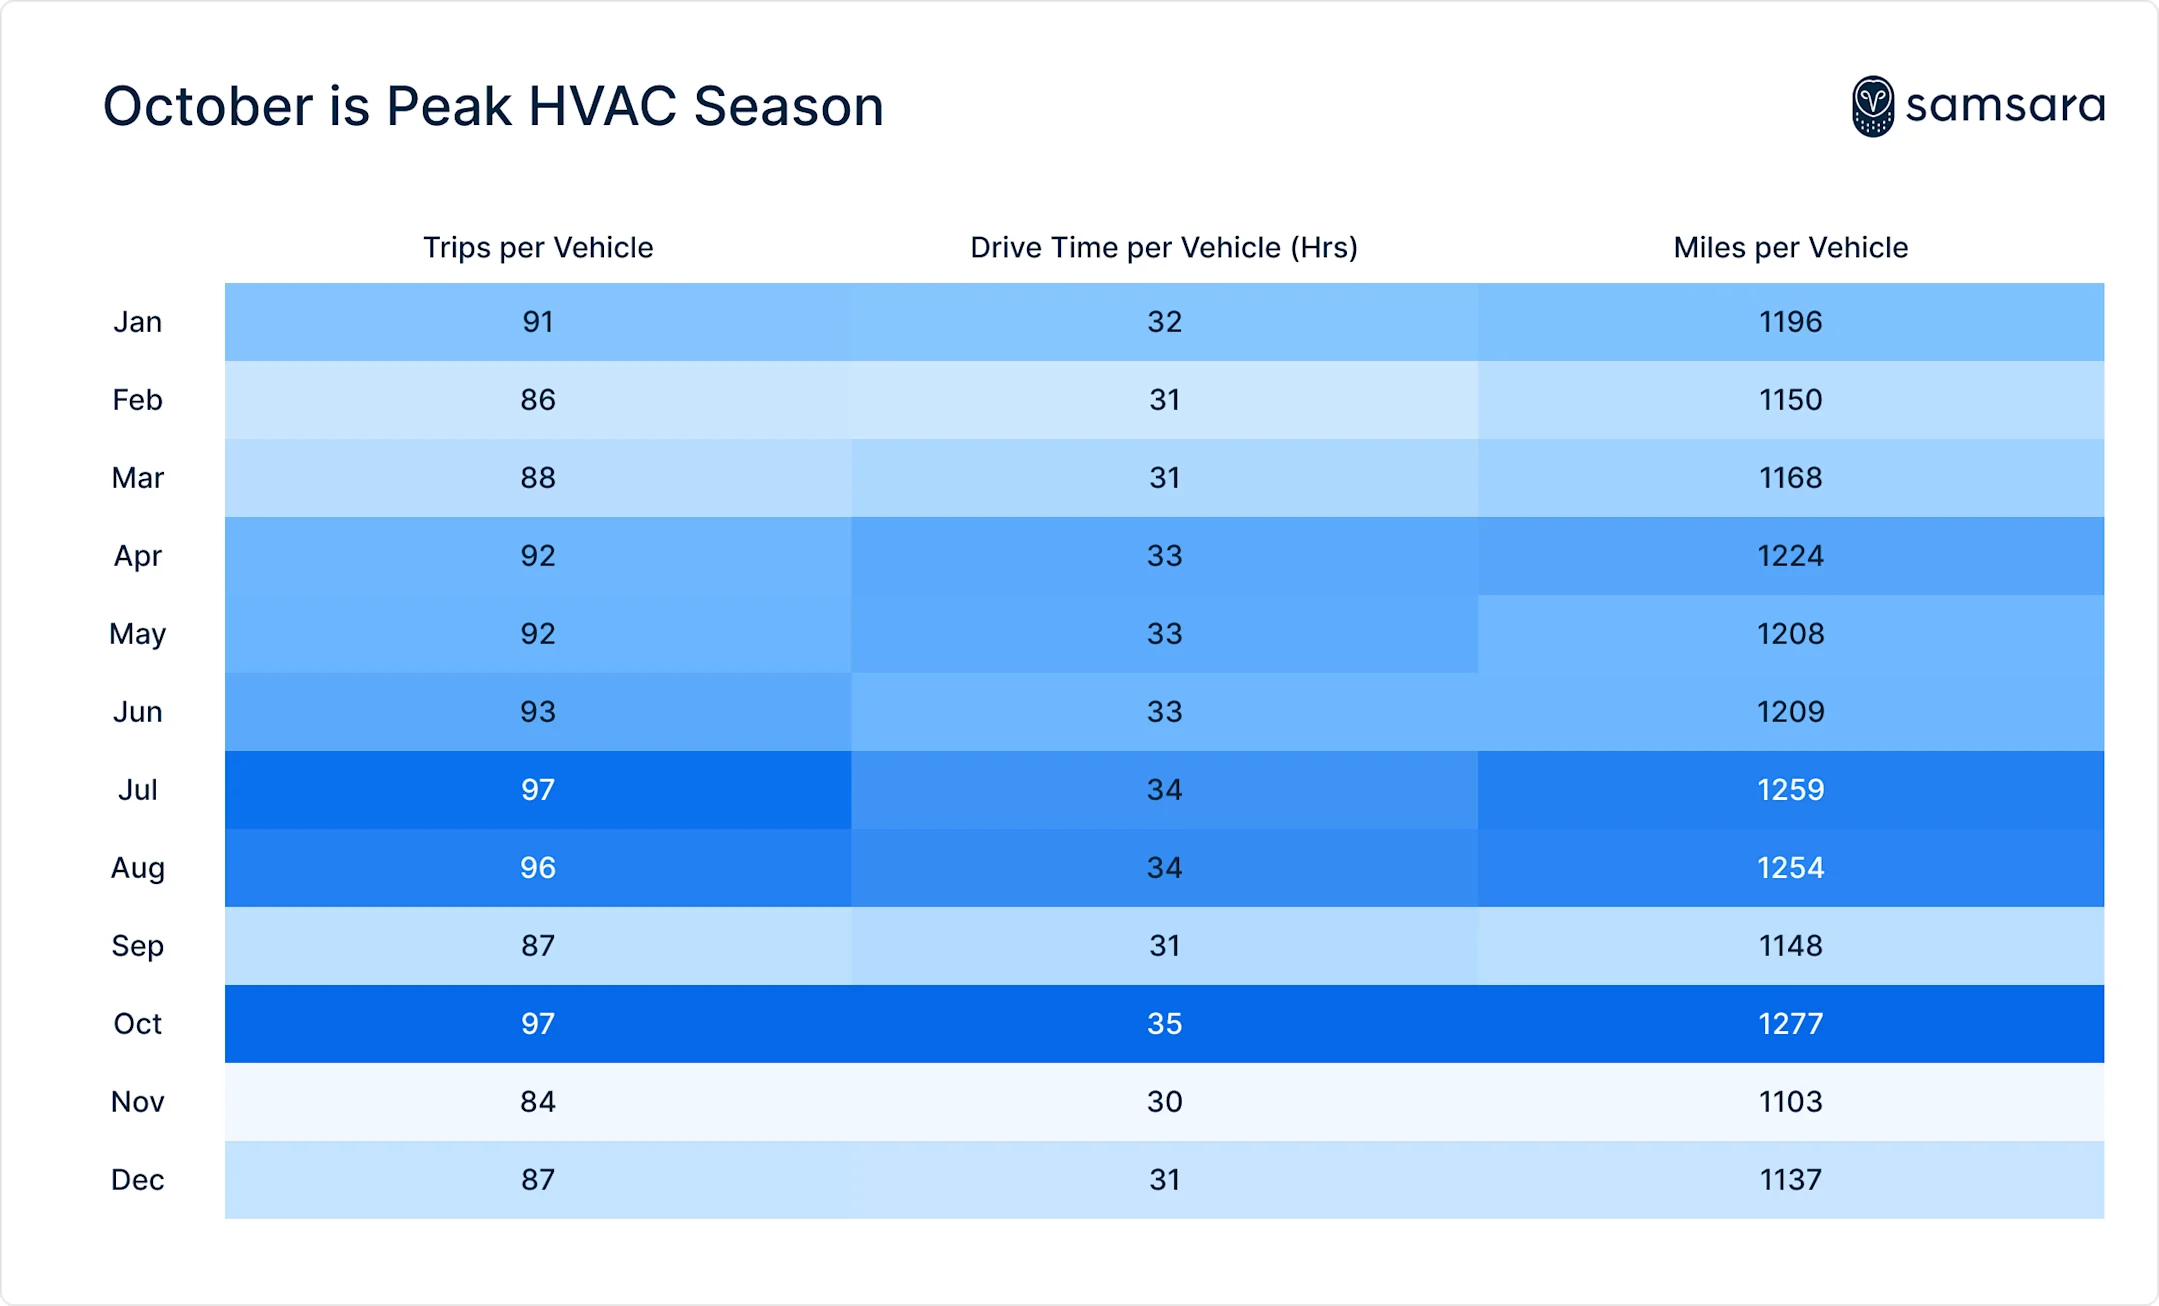
HVAC service season kicks off in July and typically stretches through October, with demand—measured by trips per vehicle—climbing from a February low, peaking in October, and tapering off by winter.
But trip volume isn’t the only signal. Drive time and mileage per vehicle follow similar patterns—rising with summer heat and dipping in early fall.
Here’s how that seasonality played out over the past 18 months.

The ramp-up isn’t without pause: September shows a consistent and notable dip in demand, even as summer temperatures persist in many parts of the country. This isn’t an anomaly—it’s a well-known “shoulder season” in the HVAC world. Air conditioners begin powering down as summer heat recedes, while heating systems haven’t yet been activated.
The result: fewer breakdowns, fewer service calls, and a momentary reprieve for technicians before the fall rush arrives in October. Industry data supports this seasonal rhythm. According to the Air-Conditioning, Heating, and Refrigeration Institute (AHRI), HVAC equipment shipments dipped in September 2024 before spiking again in October. HVAC businesses have long referred to September as part of their slow season—a narrow window of mild temperatures and low call volume, tucked between two much busier extremes.
Another byproduct of the September slump? Lower costs. Service calls can be 20%–40% higher in summer for air conditioning-related visits. Diagnostic and service call fees—which might usually be $75–$200 — can rise to $300 or more during the summer, and emergency service rates may double or triple—sometimes $140–$400/hr or more for off-hours/holidays.
The takeaway? September offers a key respite to get HVAC servicing done that is easier both on energy grids and on consumer wallets.
Where HVAC demand runs hottest
Given the country’s geographic and climate diversity, it’s no surprise that HVAC service demand varies significantly by state. To level the playing field, we analyzed average monthly trips per vehicle—removing population as a variable. The results highlight not just where HVAC systems are working hardest, but also where they may be under the most stress.
High trip volume often signals inconsistent or overstretched systems, not just high temperatures. For HVAC businesses, that means every mile matters—and that better tools and visibility can translate directly into operational resilience.
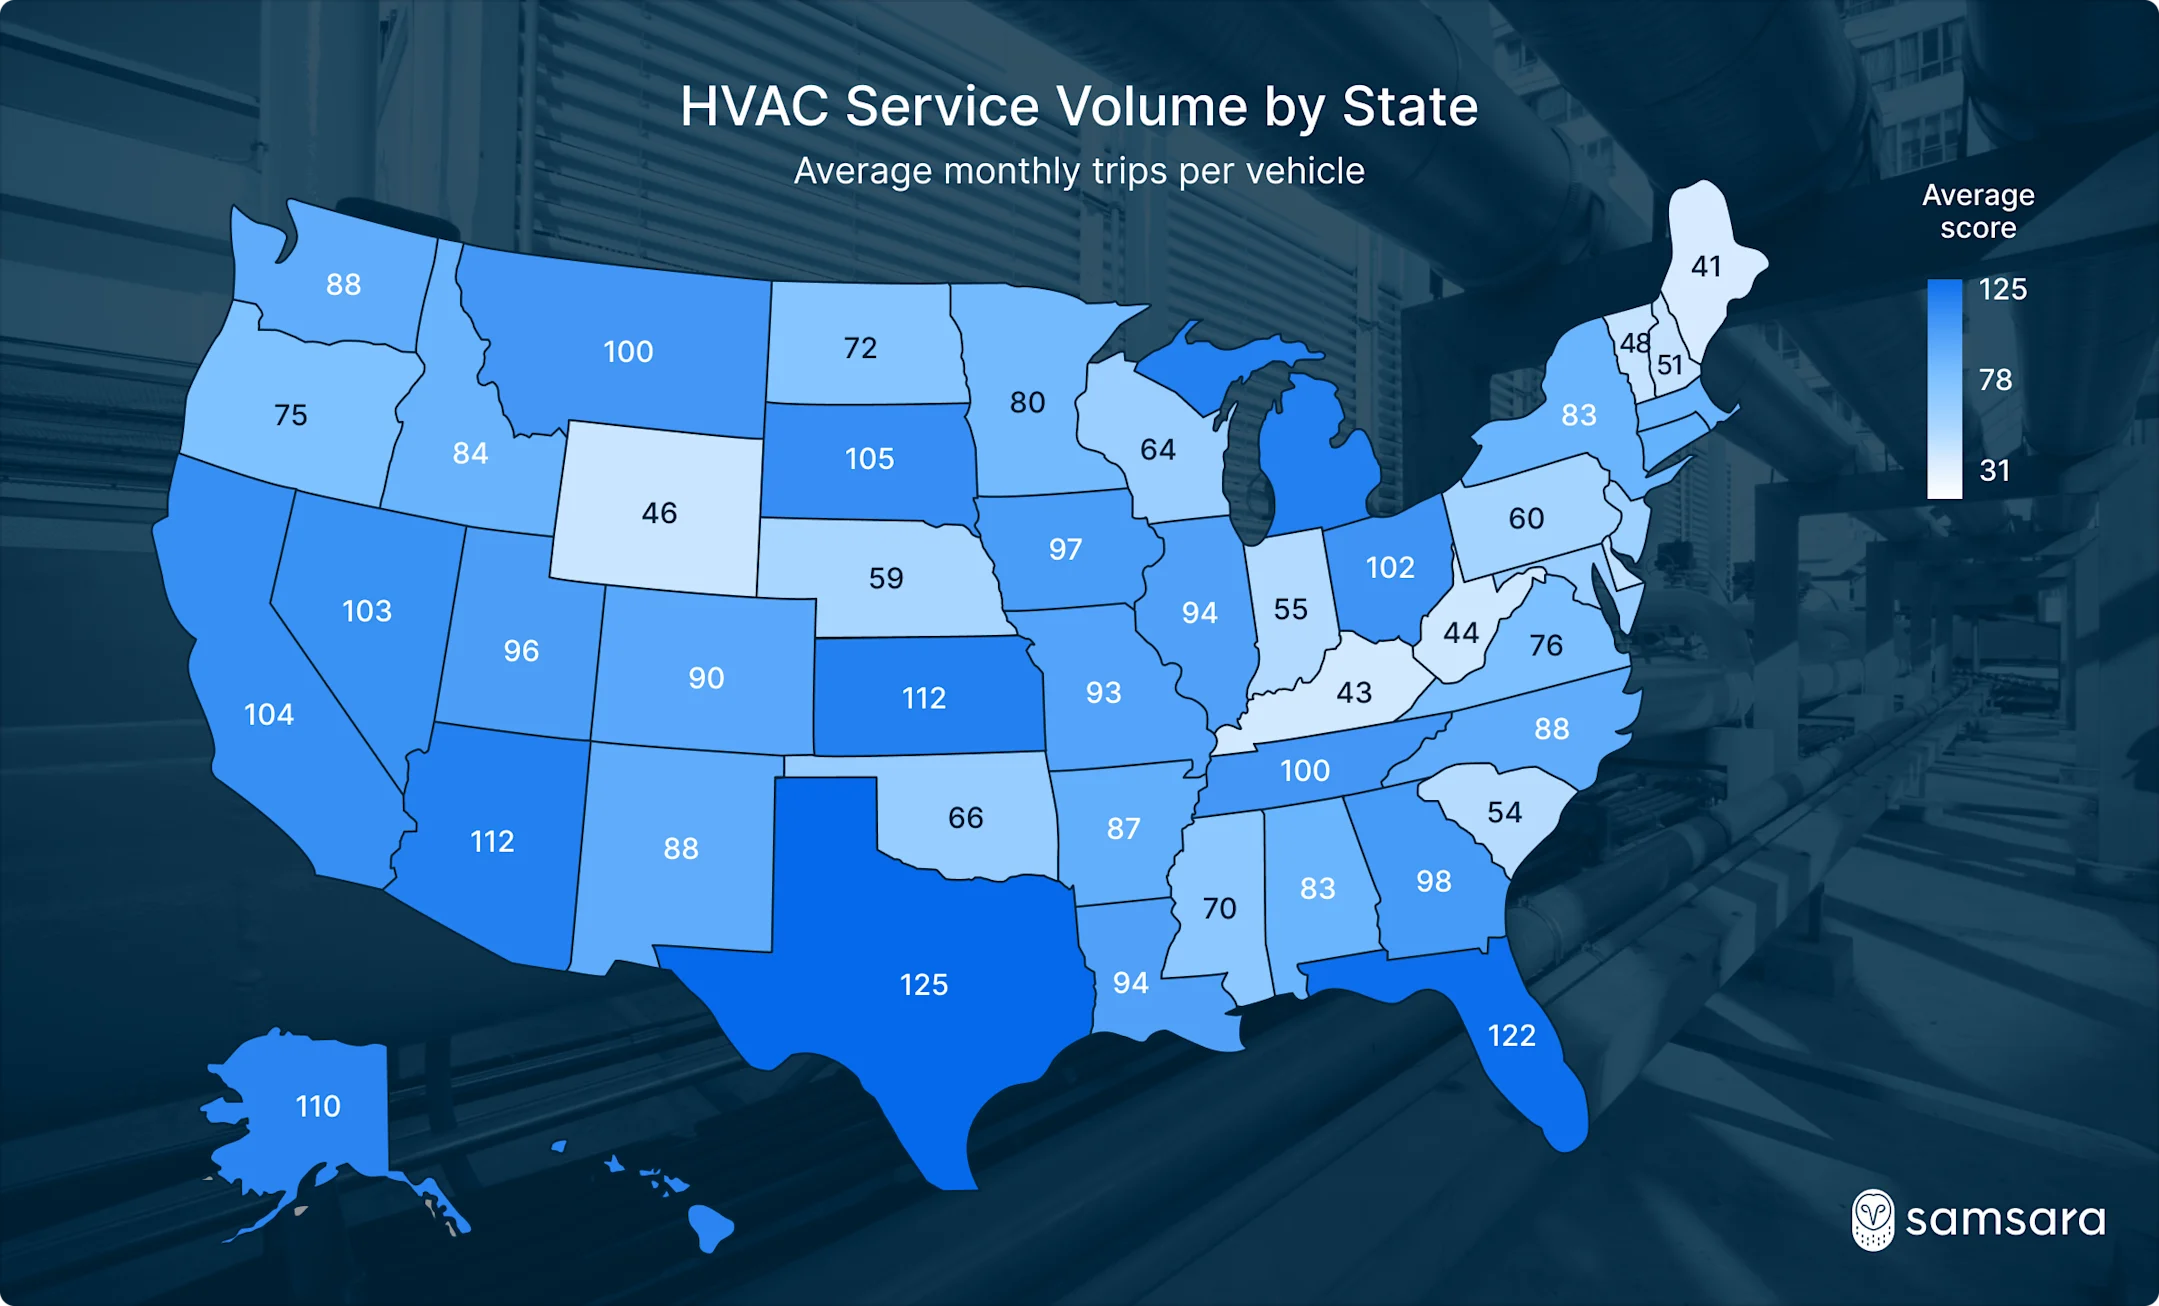
Samsara data show that Texas leads the nation in average HVAC service volume per vehicle. This aligns with its extreme weather variability, rapid population growth, and unique position as the only U.S. state that operates its own electrical grid (ERCOT), largely isolated from the national networks. During periods of intense heat or cold, this self-contained system can strain HVAC systems and the technicians who maintain them.
According to the U.S. Energy Information Administration, Texas accounts for the most electricity consumption of any state, and its grid must often accommodate rapid swings in demand driven by air conditioning load in summer months. Combined with longer travel distances between jobs, this contributes to higher service volume per vehicle—a proxy for service strain as much as demand.
Rounding out the top five are Florida, Michigan, Arizona, and Kansas—states with diverse climate challenges ranging from humidity and heat to severe winters. These states also serve a dispersed population across wide rural coverage areas. In particular, Michigan’s dual-season is driving increased demand — coupled with an HVAC labor shortage — resulting the perfect storm for year-round HVAC activity (unlike cooling- or heating-dominant states):
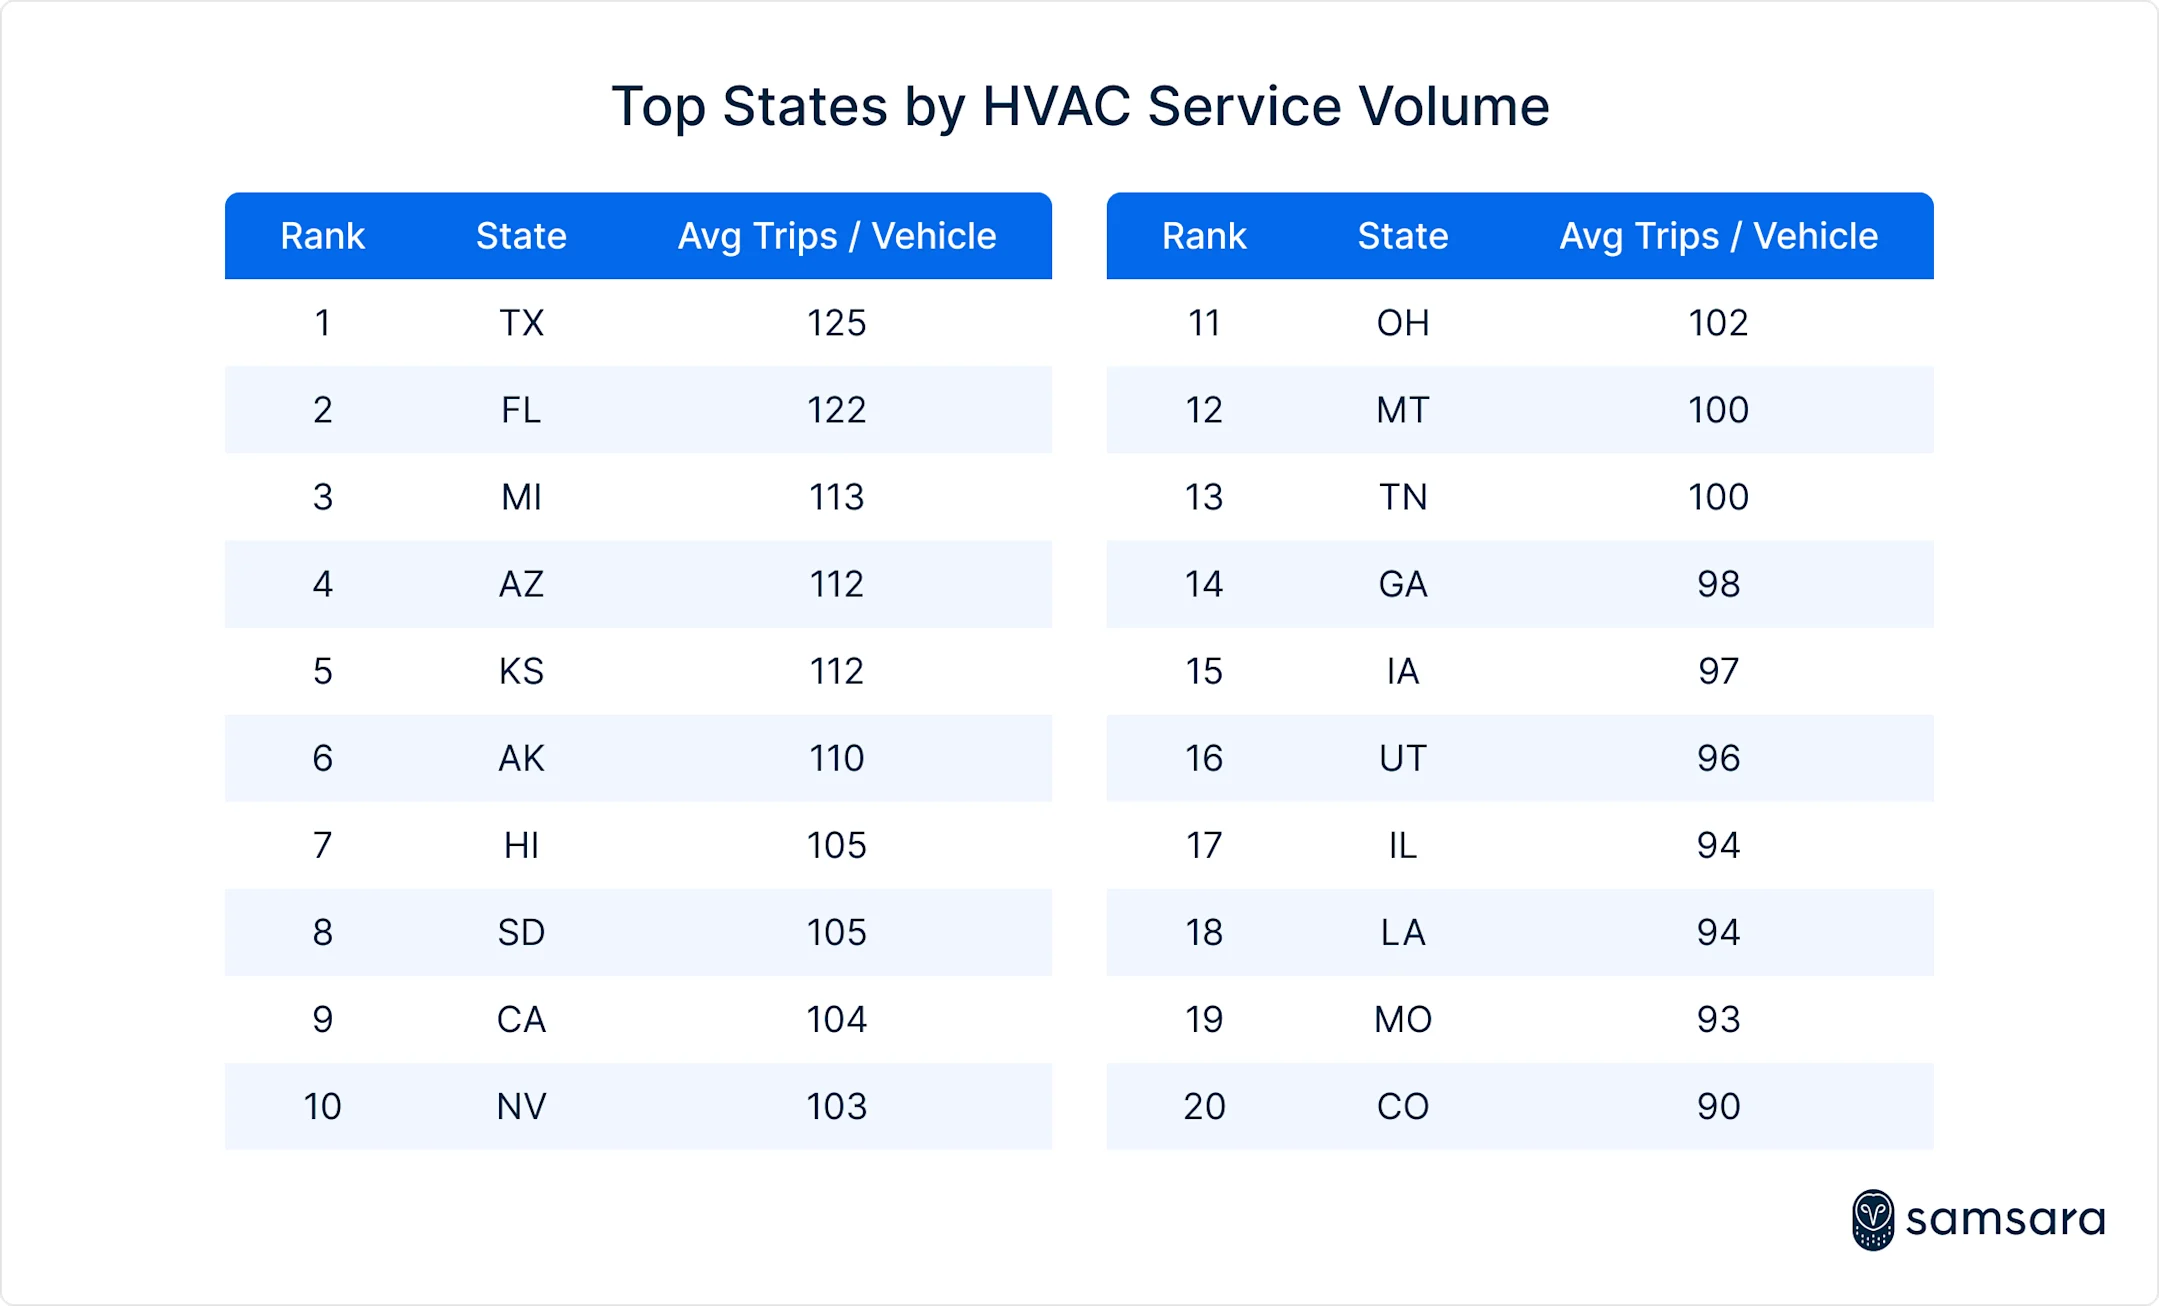
California, the U.S.'s most populous and geographically diverse state, ranks No. 9 in HVAC service volume per vehicle—pointing to relatively higher system efficiency. Spanning 37 degrees of latitude, its demand is spread across temperate coastal regions, newer infrastructure, and strict energy standards, which help reduce strain on individual fleets.
By contrast, Alaska ranks No. 6 despite its ranking 48th in population, thanks to harsh winters, remote service areas, and aging systems driving higher per-vehicle workload. Montana, at No. 19, sees wide temperature swings that create consistent demand, though its lower density keeps total trips down.
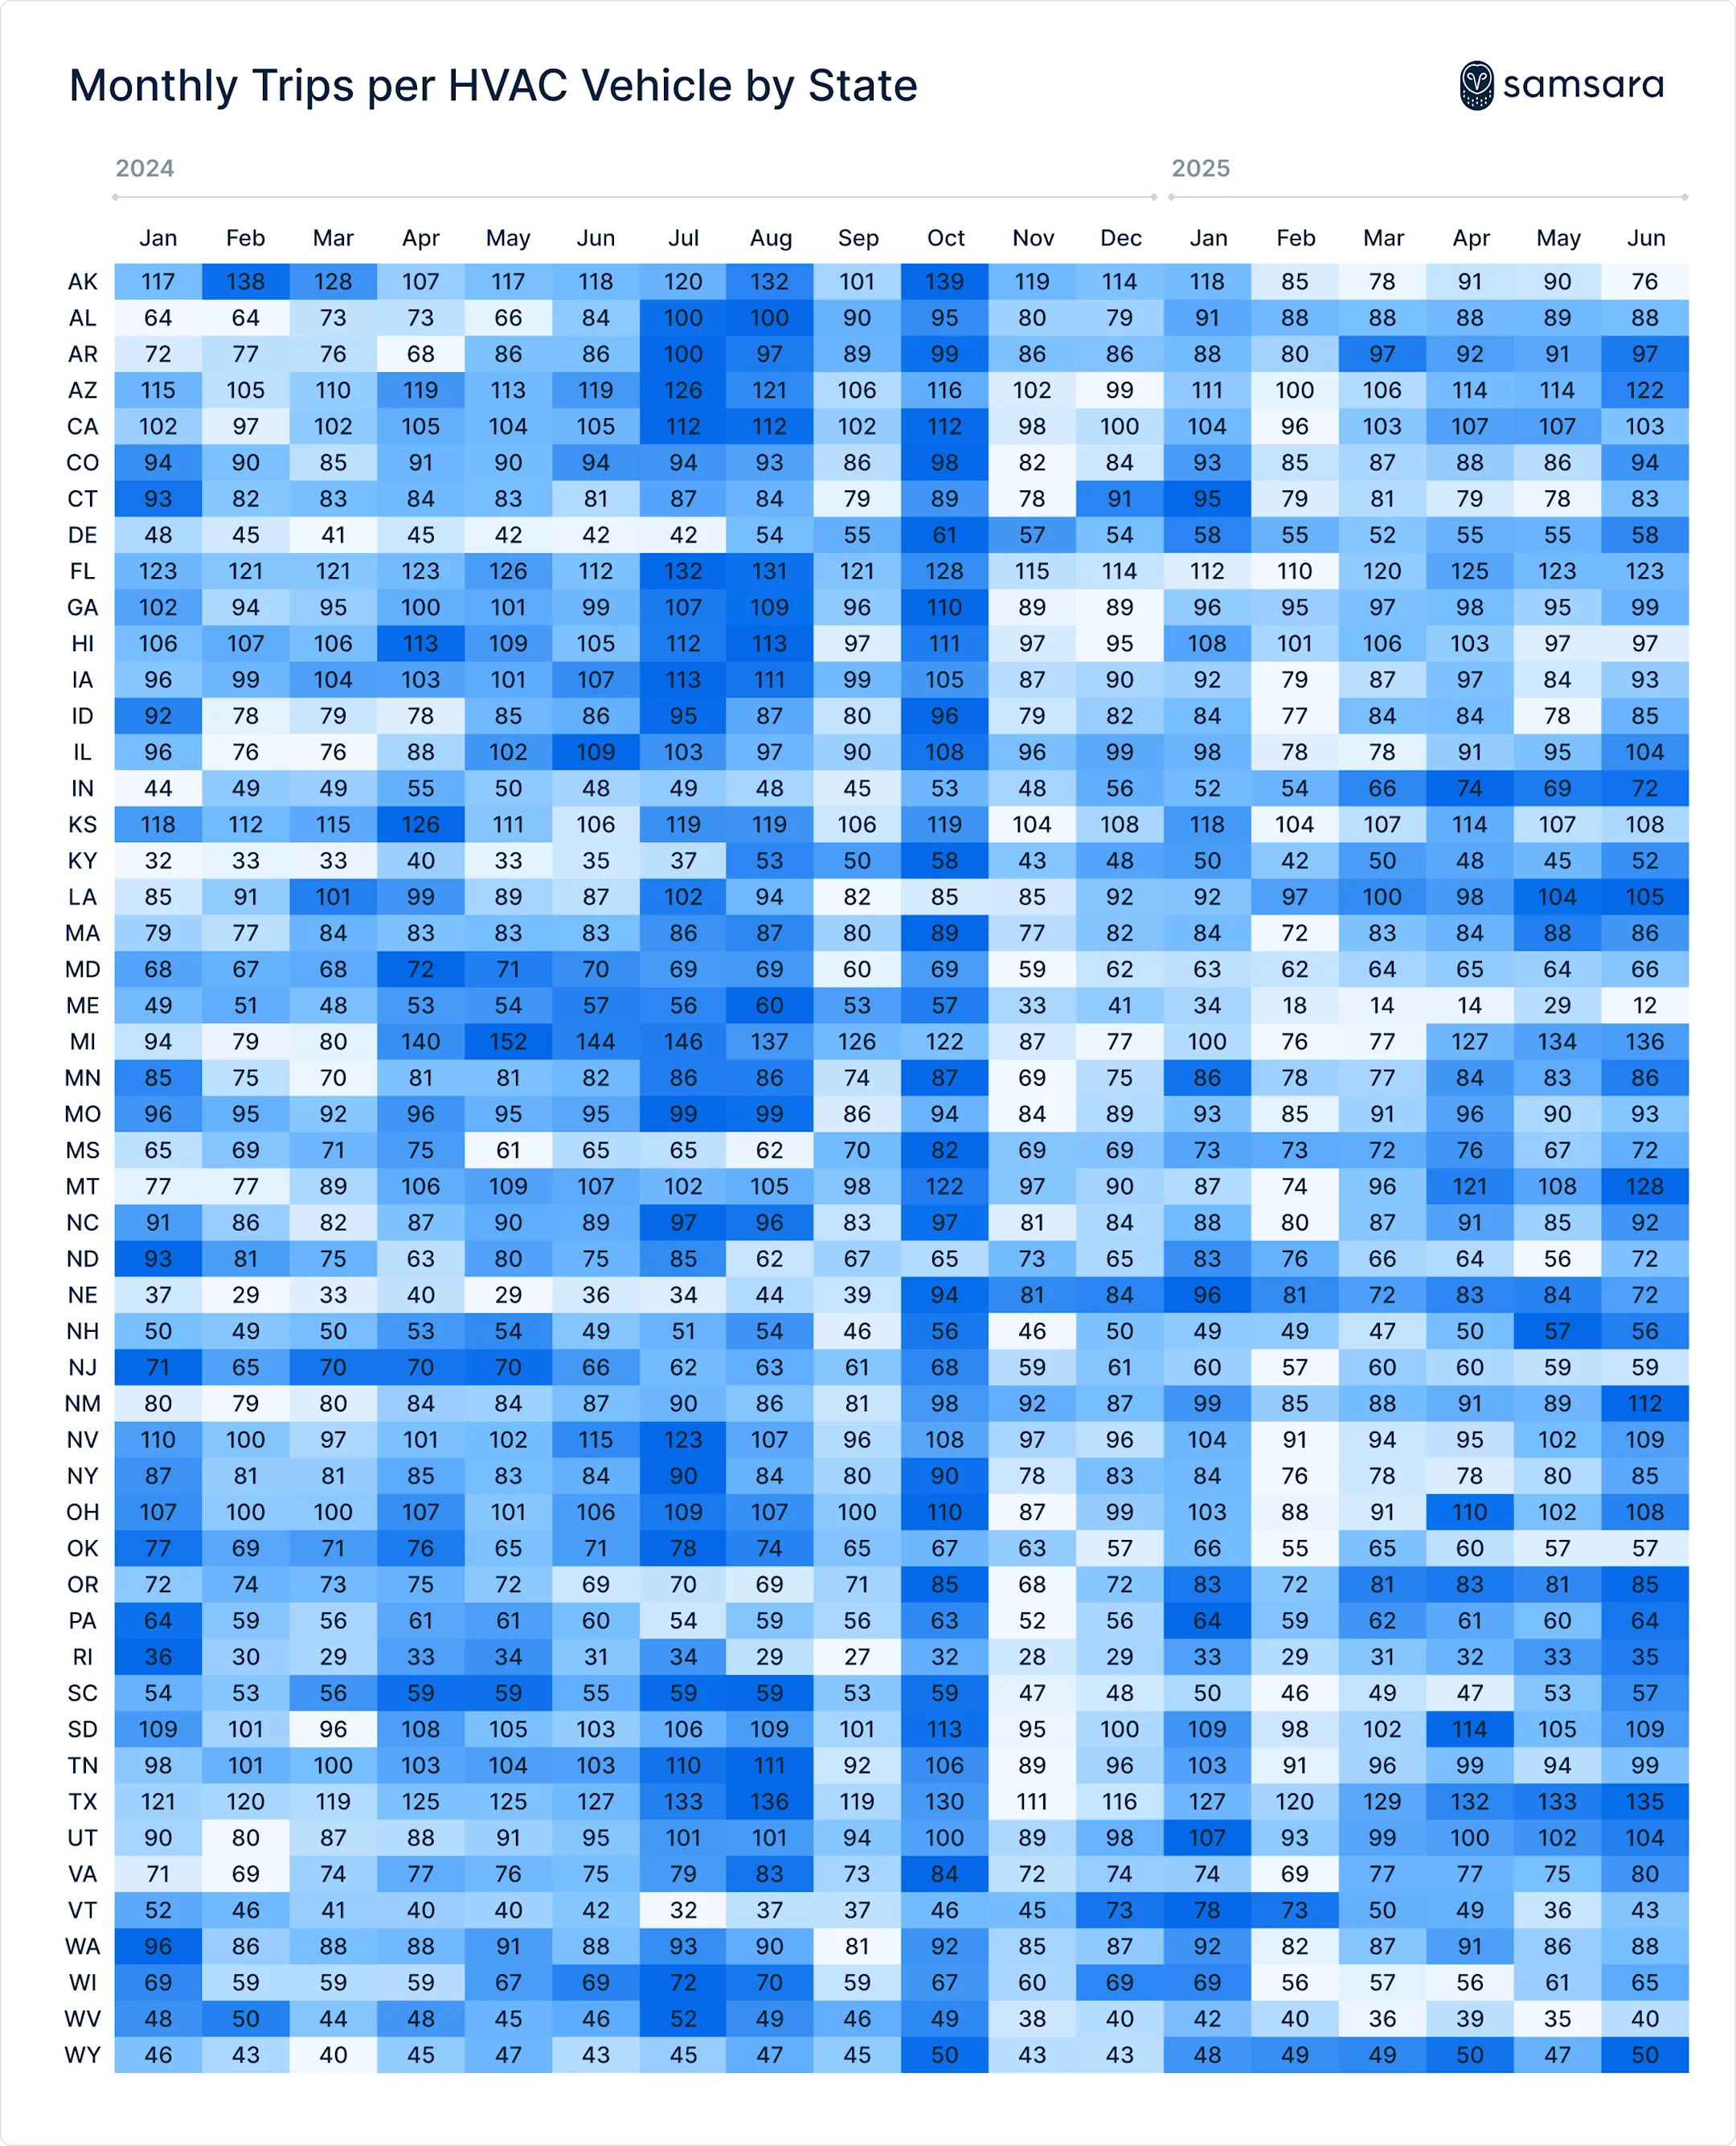
This data reflects average monthly trips per vehicle across a full year; when laid out in a heat map linearly by month—despite the geographic variance across the U.S.—a singular trend becomes apparent: October is peak HVAC season.
Spotlight: June 2025 Heat Wave
From June 22–25, 2025, an intense heat wave brought record-breaking temperatures and strained energy grids across the world. To learn more about how these temperatures cause demand for HVAC services to spike, Samsara analyzed the drives of HVAC technicians across the United States for the months of June 2024 and 2025. Samsara data showed that traditionally cooler states, such as Maine, Alaska, and Iowa, recorded the biggest year-over-year strain on HVAC service providers. Here’s a look at the 5 states that saw the biggest YoY increase in trips per vehicle:
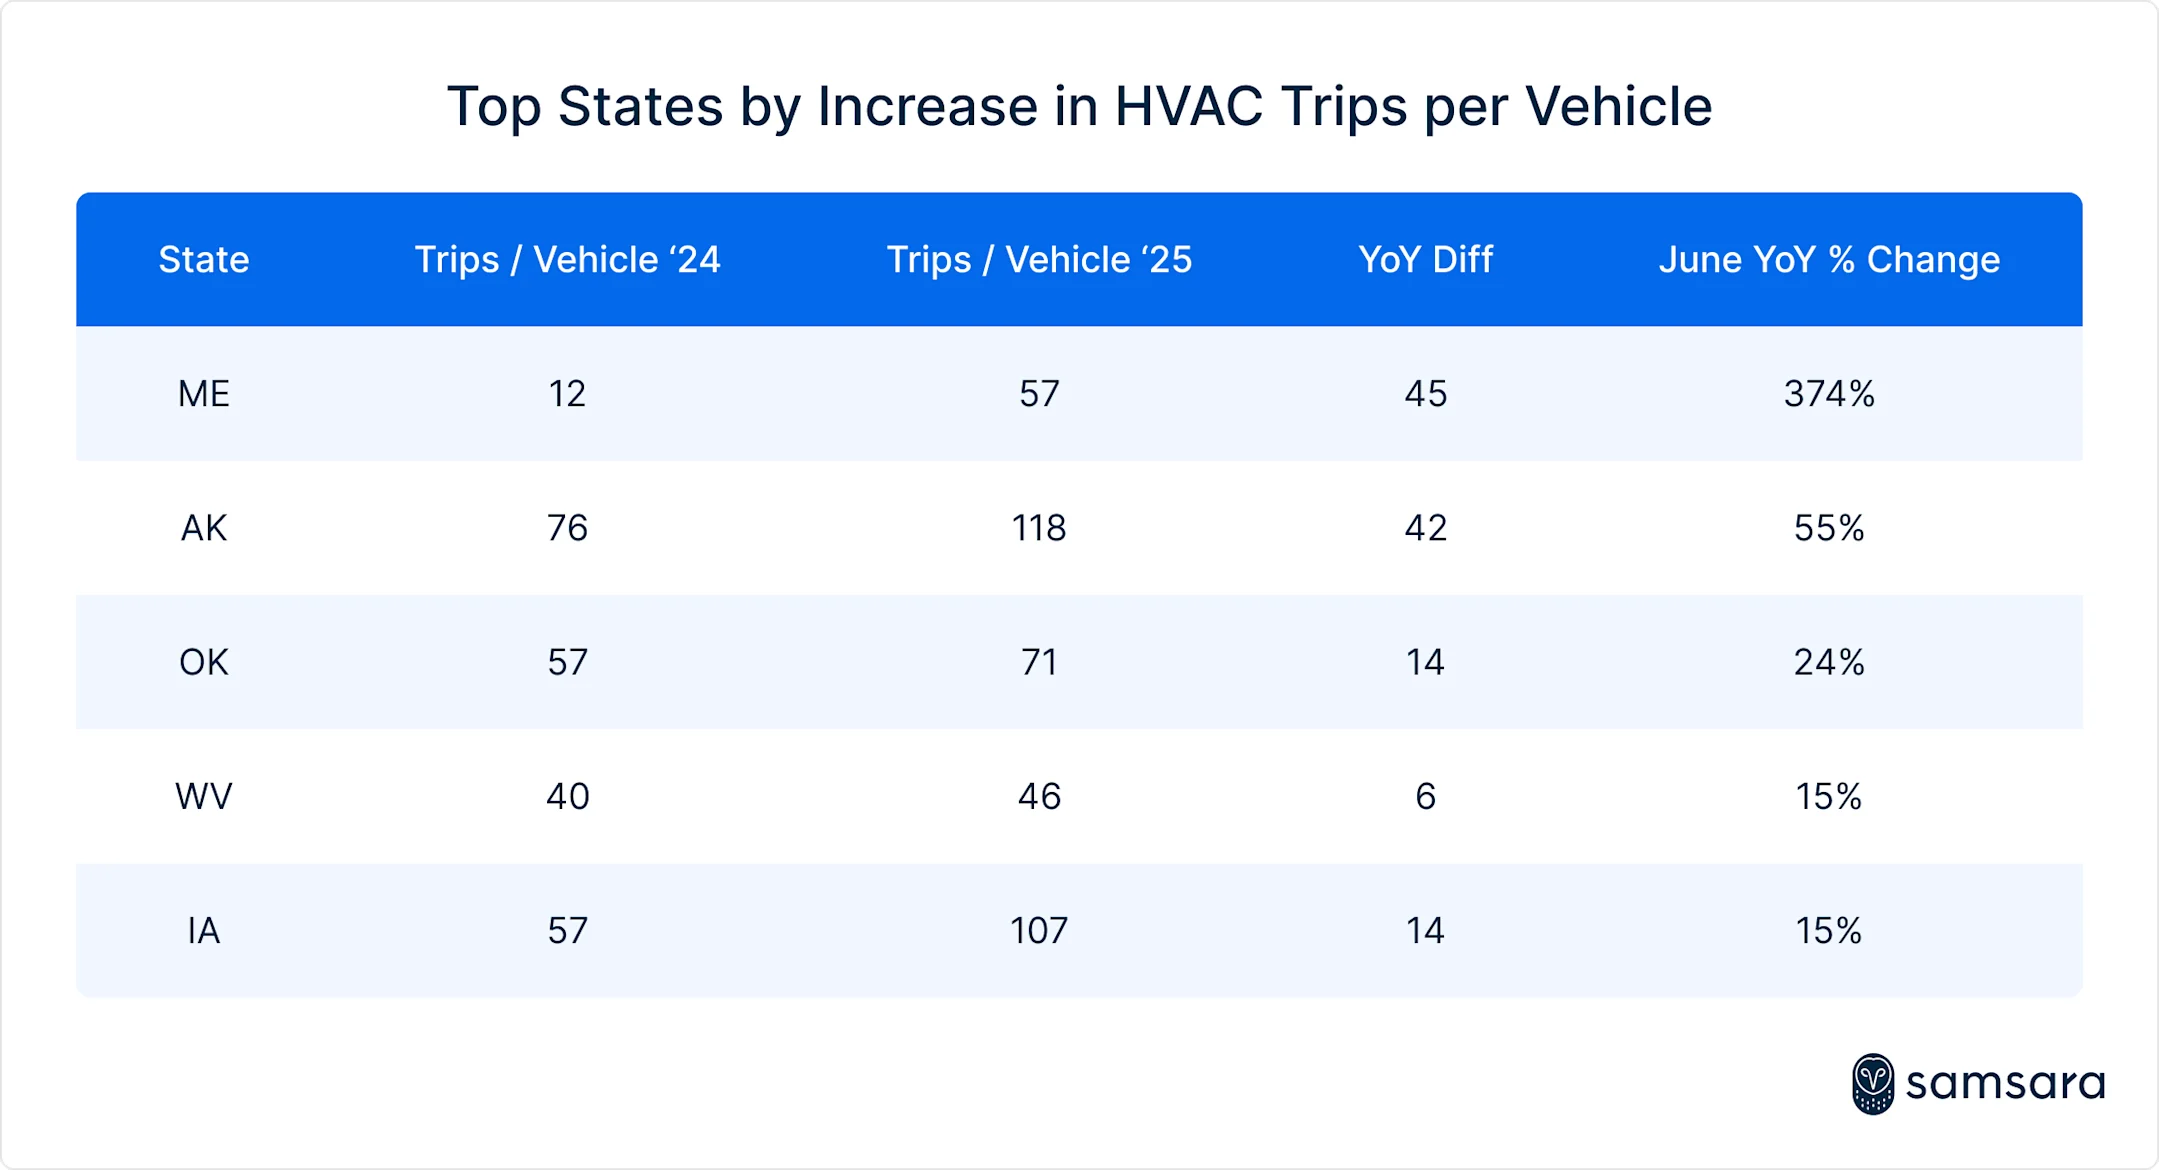
Maine showed the most remarkable year-over-year shift as coastal cities such as Augusta hit 100 °F, broke local records by 7 degrees Fahrenheit, while New England’s grid recorded its highest electricity demand since 2013. During the same period, Samsara fleet data shows HVAC technicians in Maine completed 45 more trips per vehicle than in June the year prior—an increase of 374%—and drove an additional 758 miles per vehicle, indicating not only heightened demand but also a broader geographic spread of service calls. Meanwhile, Alaska, which issued its first-ever official heat advisory, saw average June temperatures climb 1.6°F above normal and experienced lightning-driven wildfires in the interior. HVAC service activity in the state rose accordingly: trips per vehicle jumped by 42, a 55% increase, with each vehicle driving 523 more miles on average than the same time last year.
In Iowa, where the National Weather Service issued an extreme heat watch, HVAC fleets recorded 14 more trips per vehicle in June 2025 as compared to June 2024, according to Samsara data—signaling rising demand even in regions typically more active during winter heating season.
The June 2025 heatwave served as a stark reminder of the way warming summers increase demands on infrastructure and services, particularly in regions traditionally less equipped to handle extreme heat. We anticipate a growing need for businesses to leverage real-time data and adaptable strategies to navigate unpredictable weather patterns and ensure essential services can meet evolving public needs.
October is the true peak
Despite the association between HVAC calls and extreme heat, October—not July—consistently marks the busiest month of the year across all three measures: trips per vehicle, drive time per vehicle, and miles per vehicle.
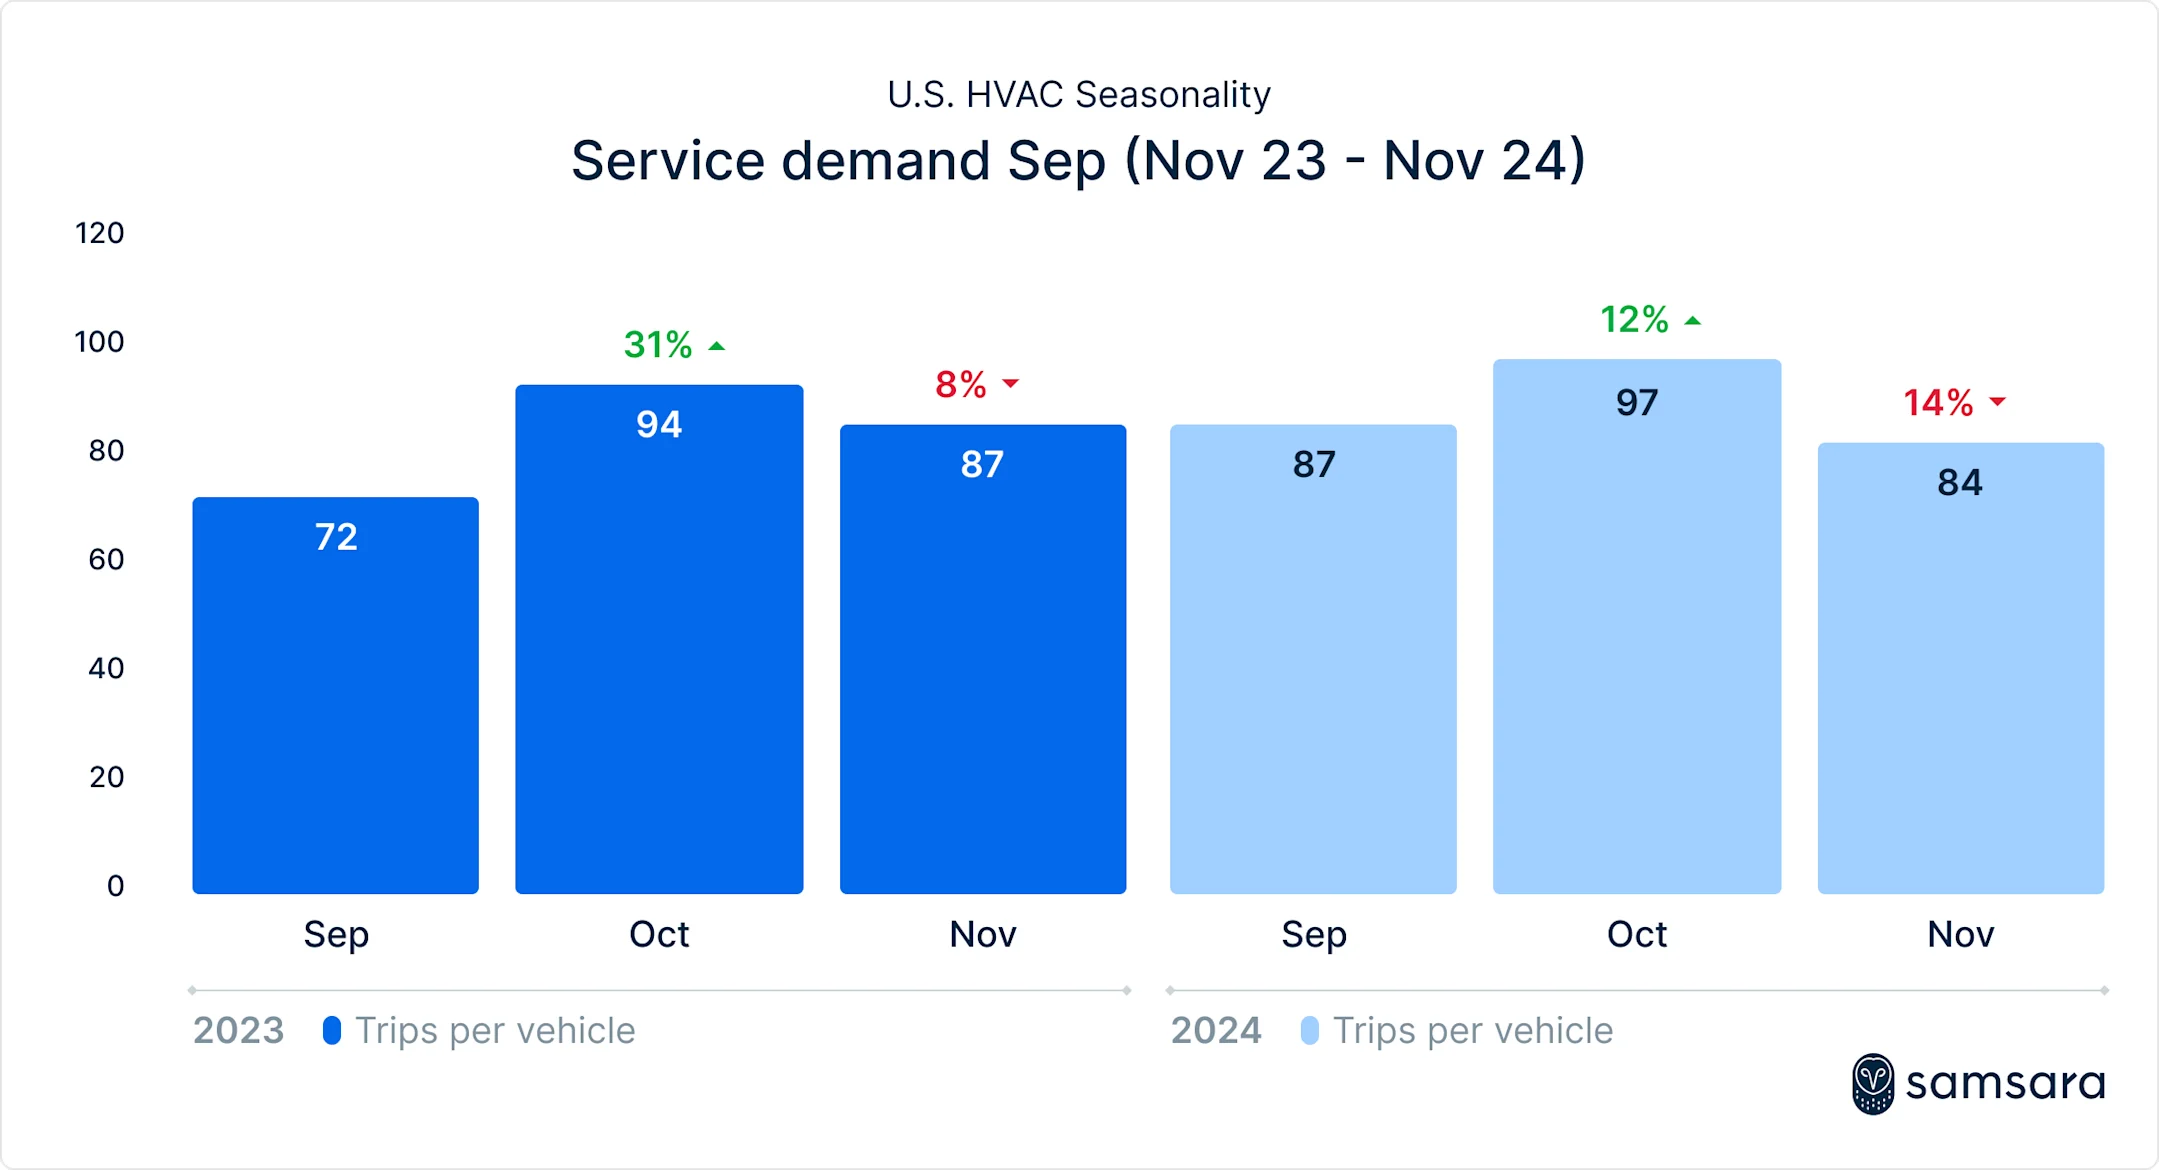
Digging in deeper, we can see this seasonal trend repeat yearly. Here’s a look at trips logged from Sep–Nov in 2023 as well as 2024, clearly illustrating the September shoulder season, October peak, and November decline across all three metrics.
So what’s driving this October spike? It’s the confluence of lingering summer heat and the reactivation of heating systems. As the first cold fronts roll in, furnaces and boilers that have sat dormant since spring are turned on—and often, break down. October becomes a critical month for both preventive maintenance and urgent repairs.
Take the state of Georgia, for example:
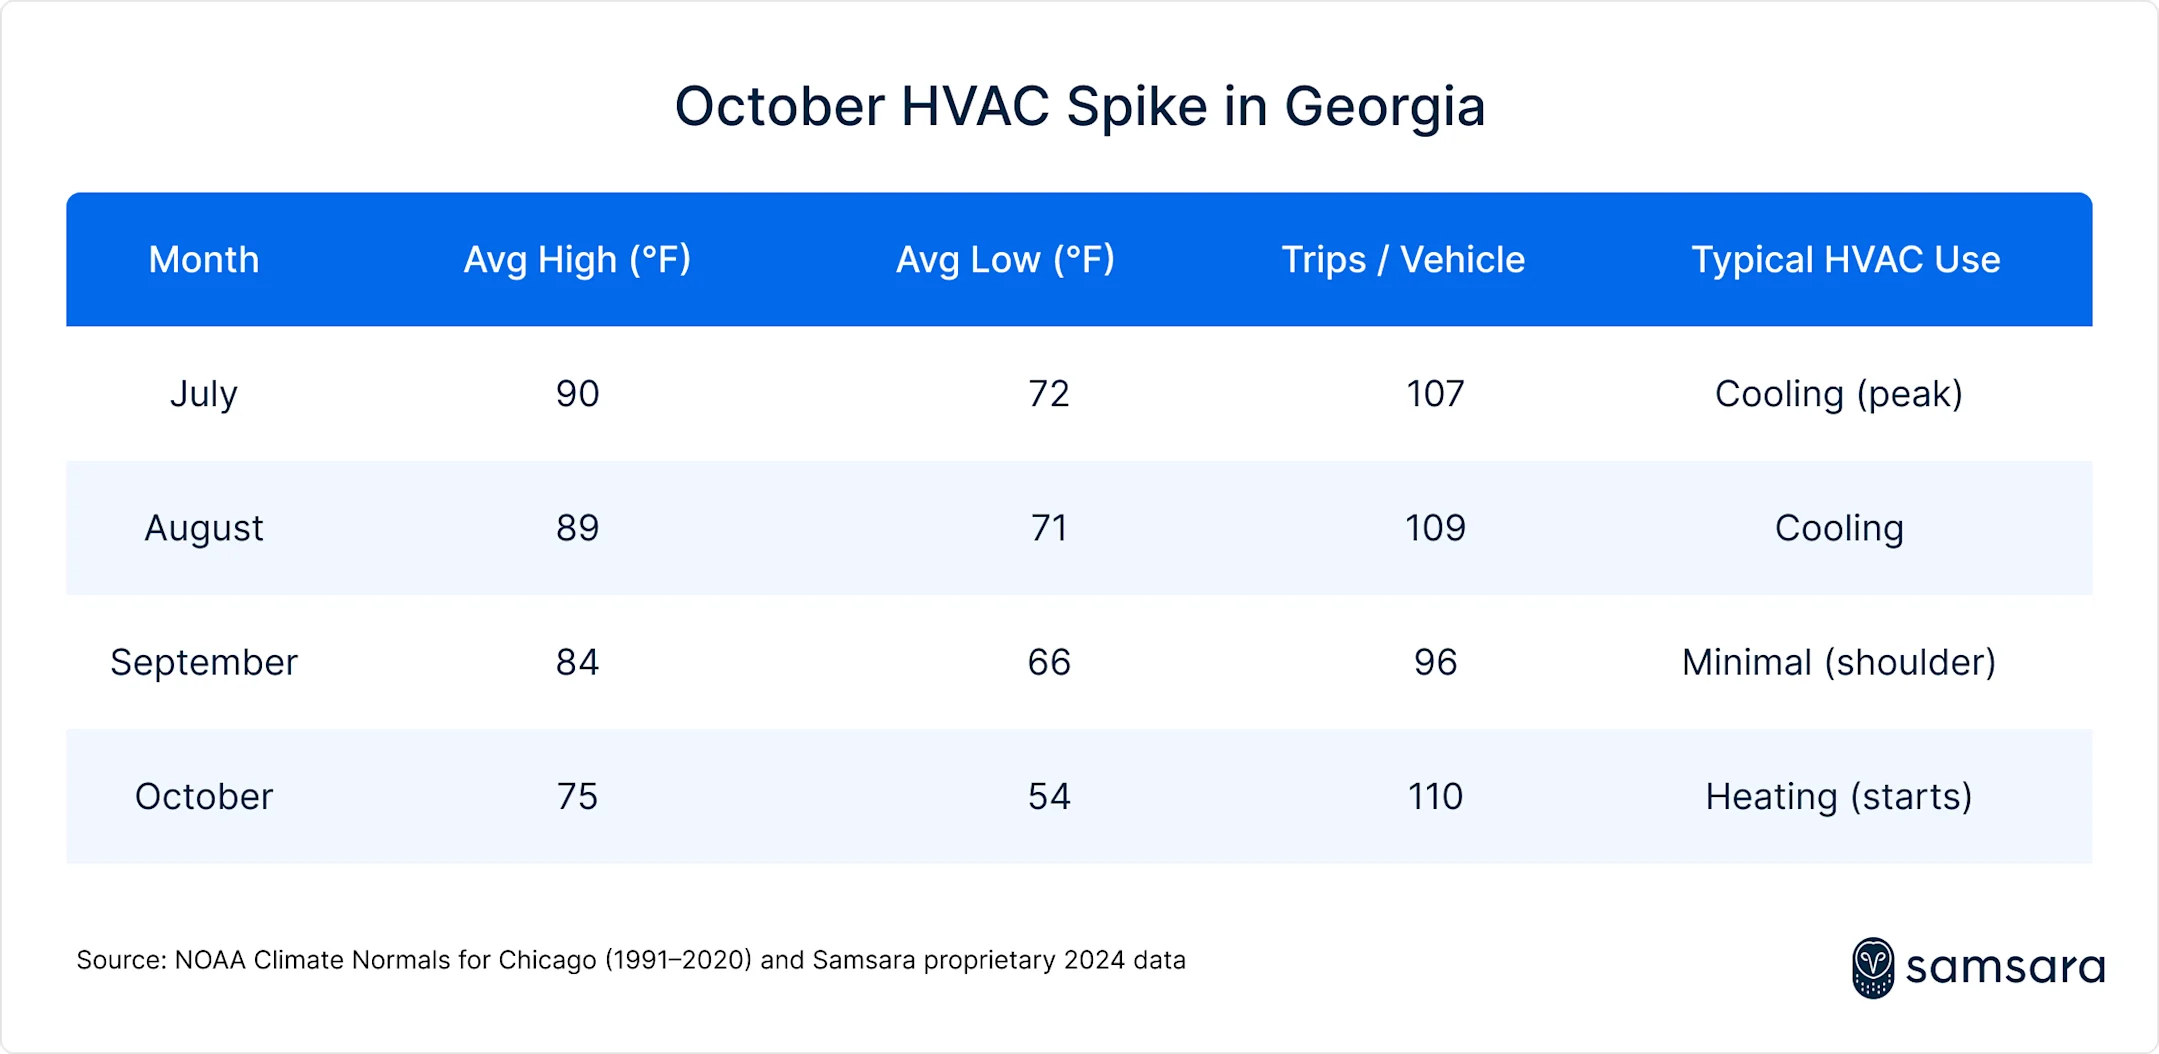
That nearly 10°F drop in the average temperature range from September to October is enough to trigger the first major wave of heating demand—especially in schools, public buildings, and commercial facilities.
So while July brings heat-related service calls, October drives more total activity across the board. The transition from cooling to heating isn’t just technical—it’s operational, and it marks the true peak of the HVAC calendar.
Stay ahead of the curve with Samsara
As the climate shifts and extreme weather events become more frequent, understanding when and where HVAC demand peaks isn’t just a logistics challenge—it’s a business imperative.
This data confirms what many in the field have long suspected: October, not mid-summer, is the busiest time for HVAC service providers. And while heat drives urgency, it’s the transition to colder weather—when systems flip from cooling to heating—that stretches resources the most.
Customer Spotlight: Bob's Heating and Air Conditioning
60% fewer vehicle incidents with Samsara
For Bob's Heating and Air Conditioning—one of the largest residential HVAC service providers in the Pacific Northwest—fleet safety and efficiency are critical during peak months.
With Samsara AI Dash Cams and driver coaching workflows, Bob's reduced vehicle incidents by 60%, helping to protect their technicians on the road while staying responsive to customer needs.
Read the full storyFrom Texas to Michigan to Georgia, the story is the same: seasonal transitions create pressure points. By using real-world fleet data to anticipate those surges, HVAC companies can better staff their teams, stock critical parts, improve fleet management, and keep communities comfortable and safe—no matter the season.
Peak HVAC season isn’t just a summer story any more. It’s a signal of what’s changing—and what we need to be ready for next.
Want to learn how Samsara can help your HVAC business prepare for peak season? 👉 Get in touch or explore more insights.
Get in touchGet the latest from Samsara
Subscribe nowRead more


The Samsara Year in Review report: A look back at your 2025

Sr. Director, Customer Marketing

Holiday Gift Guide for Frontline Workers

Head of Insights

America’s most dangerous winter roads
Head of Insights


Canada’s two seasons: Winter and construction
Head of Insights

AI reveals where and when American drivers are most distracted

Senior Data Scientist