Get the latest from Samsara
Subscribe nowNew data reveal the true peaks and valleys of the Christmastime crash risk—and why the “safe” days are fewer than you think
Winter is one of the most challenging times to be on the road—not just for truck drivers and last-mile delivery workers, but for everyone who shares the highway with them. Shorter days, freezing temperatures, and deteriorating road conditions strain winter roadways. Layer in holiday travel, heavy shopping traffic, and a surge in commercial deliveries, and crash risk becomes volatile.
Despite these risks, most drivers lack a clear sense of when the holidays are actually most dangerous—or how shifts in commercial activity shape the ebb and flow of winter crash risk.
To understand how the holiday season reshapes crash rates and how much driving is happening across commercial fleets and passenger traffic, Samsara analyzed anonymized data spanning tens of billions of miles driven between December 1 and January 7 from 2023–2025. The patterns reveal a distinctly seasonal curve—one shaped by how people travel, how freight moves, and how winter conditions interact with both.
What follows is a data-backed look at how crash risk rises, falls, and reconfigures itself from early December through the first week of the new year—and what that means for the millions of drivers sharing America’s roads.
The holiday rush
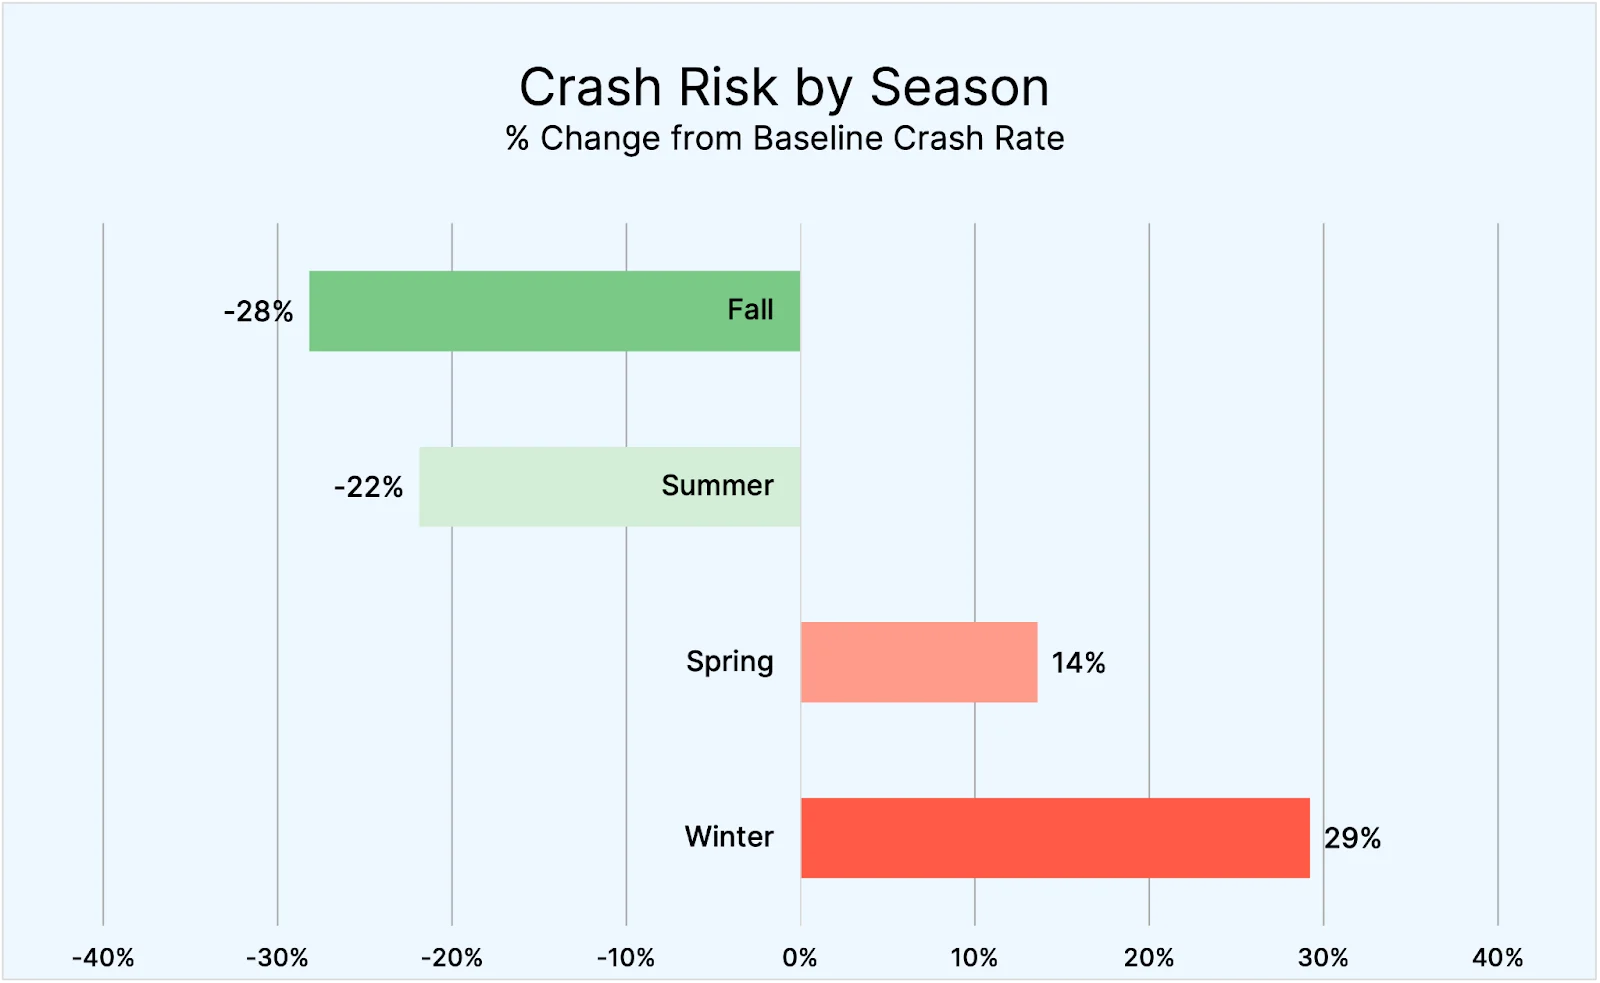
Crash risk during the holidays is shaped less by a single factor and more by convergence. Holiday travel brings more passenger vehicles onto the road at the same time winter conditions—crash rate during the winter is elevated nearly 30% compared to the annual average— reduces traction, visibility, and stopping distance. These forces overlap during Christmas and the early weeks of January, increasing shared crash risk for both fleets and the passenger vehicles around them. Here’s how crash risk changes by season:
Weekly crash rates rise from early December into Christmas week (Week 52), when long-distance holiday travel is at its highest and winter driving conditions are common across much of the country. While some commercial activity slows during this period, the remaining traffic mix shifts toward longer, discretionary trips that are more sensitive to weather and road conditions.
The year-end crossover week shows a temporary decline in crash rates, reflecting a brief reduction in overall driving activity around New Year’s Eve. That dip does not persist. In Weeks 1 and 2, crash rates rise again as commercial fleets return to regular operations while post-holiday passenger travel continues and winter conditions remain in effect. This overlap increases risk for all road users, even as traffic volumes begin to normalize.
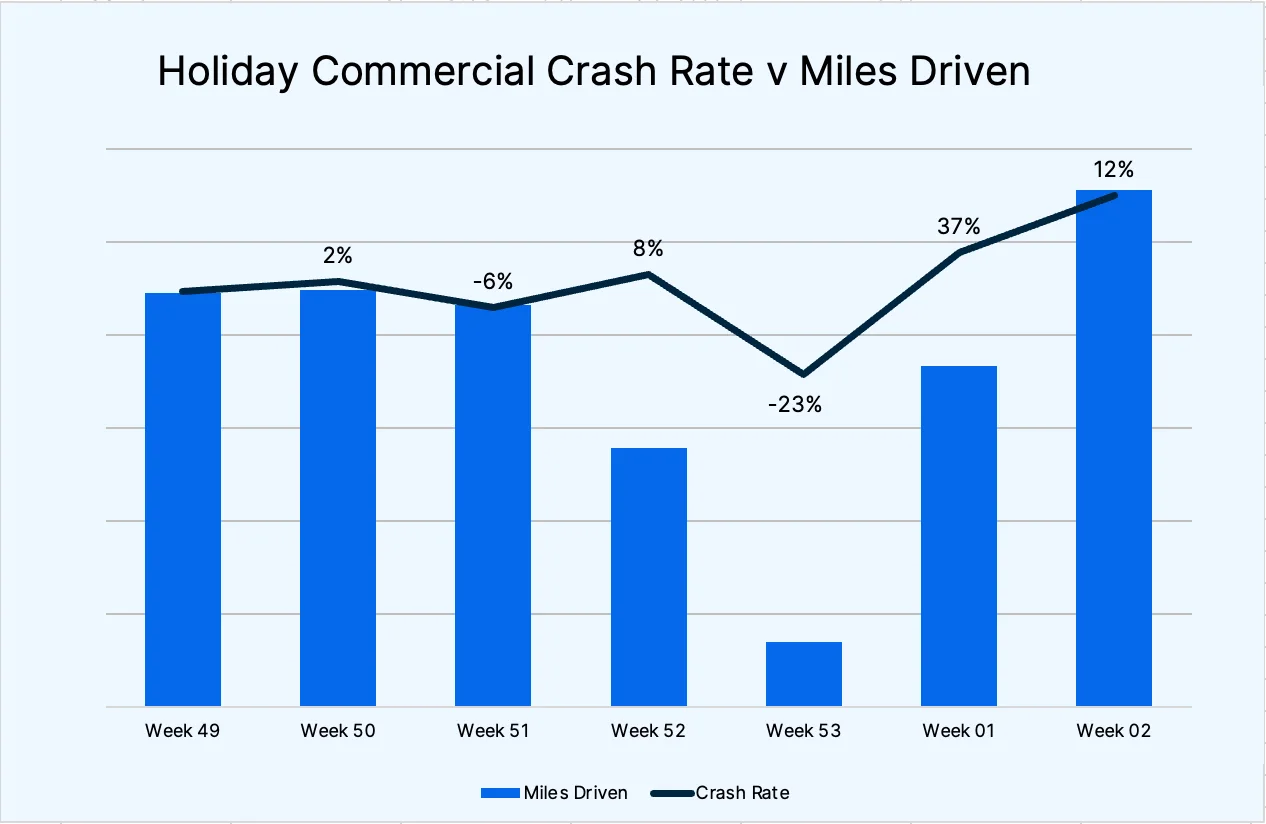
Holiday crash rates by week (ISO weeks)
Week | Holiday context | Week-over-week change |
Early December (Week 49) | Baseline | — |
Week 50 | Holiday travel increasing | 2% |
Week 51 | Late-December travel | -6% |
Week 52 | Christmas week | 8% |
Week 53 | Year-end / New Year’s Eve | -23% |
Week 1 | Fleets return to road; holiday winter travel surge | 37% |
Week 2 | Fleet and commuter traffic resume | 12% |
Weekly averages provide context, but they smooth over increased risk around daily holiday travel patterns.
Crash risk peaks around Christmas travel, not Christmas Day
Daily crash data show that the highest crash risk of the holiday season concentrates into the days surrounding Christmas travel, rather than Christmas Day itself. Crash rates decline Christmas Eve and Christmas Day, and then rebound as return travel begins.
This pattern reflects the convergence of holiday travel timing and winter driving conditions. As more drivers take longer, discretionary trips—often on unfamiliar routes—risk per mile increases even as total activity fluctuates.
Daily crash risk around Christmas (Dec 23–26)
Date | Day-over-day change |
December 23 | +36% |
December 24 | –23% |
December 25 (Christmas Day) | –17% |
December 26 | +30.0% |
While Christmas Day shows lower crash risk—driven by a sharp reduction in miles driven—that reduction is short-lived. Crash rates rebound on December 26 as return trips begin and travel patterns shift again, underscoring that risk does not steadily decline after the holiday.
New Year’s sees lower crash rates—but higher-risk conditions
Crash rates decline in the days leading into New Year’s Eve and remain lower on New Year’s Day, reflecting a broader slowdown in both commercial and passenger driving activity. Fewer miles are driven, and overall crash frequency falls relative to earlier in the holiday period.
However, this lower rate does not imply uniformly safer conditions. Travel around New Year’s is more likely to occur at night, when crash risk increases, and a higher share of driving takes place during late-evening and early-morning hours, when visibility is reduced and impaired driving risk is elevated. As a result, while crashes are less frequent, the risk profile shifts toward more severe conditions.
Daily crash risk around New Year’s (Dec 30–Jan 2)
Date | Day-over-day change |
December 31 (New Year’s Eve) | –5.6% |
January 1 (New Year’s Day) | –1.1% |
January 2 | +34.4% |
Crash rates rise again on January 2 as travel resumes and fleets return to the road, bringing commercial and passenger traffic back into closer alignment under winter conditions. This convergence increases shared crash risk, even as the holiday period officially ends.
Holiday crash cluster hotspots (Dec 23–Jan 3)
Cluster Rank | Hotspot | Cluster Concentration | Regional context |
1 | NY–NJ Metro Corridor | Freight and commuter corridors between Newark, Jersey City, and approaches into New York City | Dense overlap of port traffic, regional trucking, and post-holiday passenger return travel |
2 | Port of Long Beach Area | Truck routes surrounding the Port of Long Beach and nearby industrial corridors | High concentration of short-haul freight linked to holiday retail imports and urban traffic |
3 | Central New Jersey | Highway and arterial networks between Trenton and New Brunswick | Key Northeast logistics pass-through where regional freight and passenger traffic converge |
4 | Southeastern Massachusetts | Regional road networks south of Boston, including coastal and inland connectors | Mix of regional holiday travel and winter weather exposure on non-interstate roads |
5 | Inland Empire Logistics Zone | Distribution corridors east of Los Angeles, near major warehousing hubs | One of the nation’s largest warehouse concentrations, with late-December freight surges |
Conclusion
The Christmastime crash curve shows that holiday driving risk is not defined by a single day or a simple rise-and-fall pattern. Instead, risk shifts as travel timing, traffic mix, and winter conditions converge, creating short windows where crash risk is meaningfully higher—even as overall driving activity fluctuates.
The most dangerous periods are not the holidays themselves, but the days surrounding them: the rush to reach destinations before Christmas, the uneven return trips that follow, and the early-January overlap when commercial fleets return to the road while passenger travel and winter conditions persist. While some days see fewer miles driven or fewer crashes overall, those reductions are often brief and do not eliminate shared risk on the roadway.
For drivers and fleets alike, the takeaway is clear: holiday risk is shaped less by how much driving is happening and more by when travel occurs, who is on the road, and the conditions they face. The “safe” days are fewer than they appear—and understanding how risk concentrates around specific travel windows is key to navigating the holiday season more safely.
Samsara helps fleets stay ahead of holiday season
Winter road conditions change faster than drivers can respond—pavement friction can drop within minutes as temperatures fall, and visibility declines earlier and more sharply. To balance out seasonal effects and operate a program anchored in safety, fleets need to shift incident response from reactive to preventative.
Increase real-time in-cab coaching: Use in-cab alerts to help drivers adjust in the moment when road or visibility changes occur.
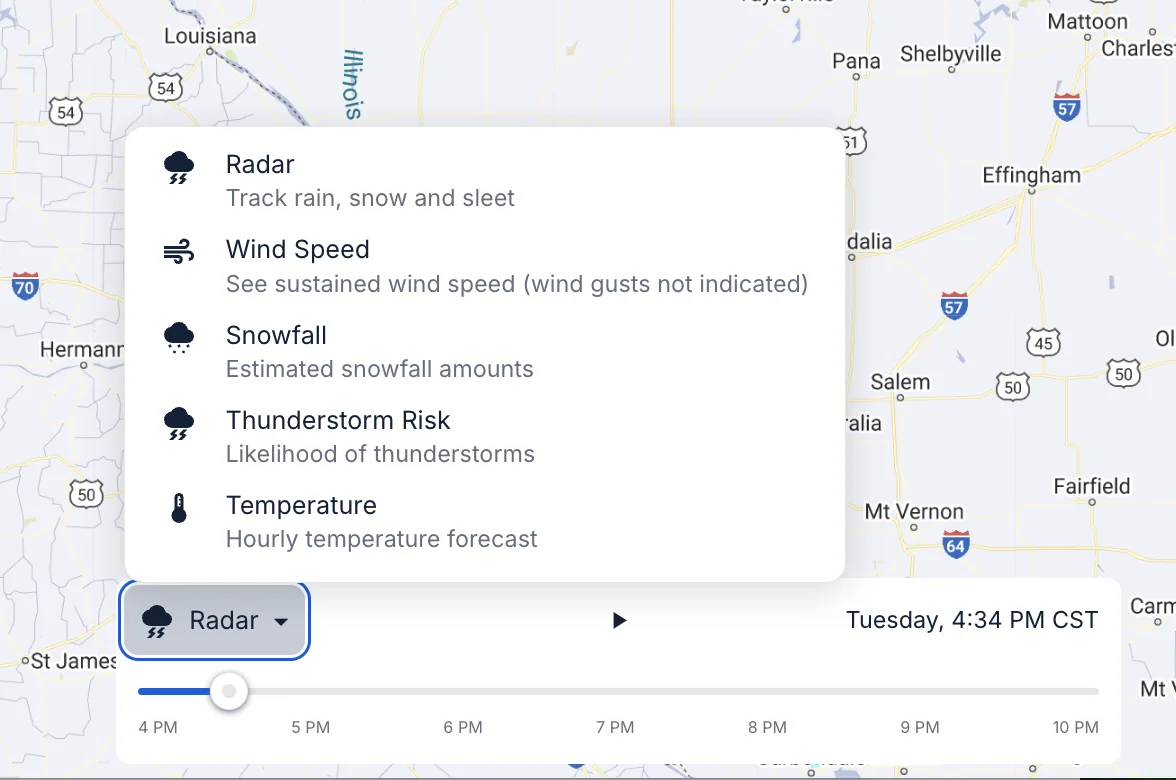
Continuously monitor weather and road conditions: Use Weather Intelligence and StreetSense to track changing conditions at the street level and alert drivers before they enter severe weather or black ice zones.
Expand visibility around the vehicle: AI dash cams and multi-cam setups provide 360-degree awareness, critical during longer dark hours and snow, rain, or fog.
Coach ahead of the risk curve: Samsara surfaces patterns in risky driving behavior so fleets can coach before these patterns escalate into incidents.
Proactively adjust operations: Use operational data to reroute, re-time trips, reduce schedules, or shift workloads when conditions deteriorate.
Seasonal solutions
Challenge | What changes in winter | Samsara solution |
Black ice is invisible until it's too late | Surfaces freeze faster overnight and in shaded highway segments. | Weather Intelligence highlights freeze risk zones and pushes alerts before drivers reach them. |
Crash risk spikes between midnight and 4 a.m. | Fatigue + impaired visibility + rapidly falling temperatures. | StreetSense™ and telematics identify which night routes and segments show the greatest risk, enabling route/time adjustments. |
Risk varies even within a single city or county | Elevation, microclimates, salt coverage, and wind exposure differ by road. | StreetSense™ provides segment-level scoring so fleets prioritize mitigation where it matters most, not systemwide. |
Not all drivers respond the same way to conditions | Coaching is often too generic or delivered too late. | In-cab AI delivers real-time alerts and adaptive coaching during conditions, not after. |
Moving from awareness to preventative action
Taking the following actions produces a step-change in how organizations manage winter operations:
Identify high-risk roadways and corridors using segment-level StreetSense™ scoring
Re-route or re-time trips based on Weather Intelligence forecasts
Real-time in-cab coaching for drivers most exposed to night or freeze conditions
Trigger operational changes (pretreatment, chain-up protocols, shift adjustments) before conditions cross thresholds
The result is not just fewer crashes, but fewer delays, fewer emergency responses, fewer claims, and fewer out-of-service vehicles when fleets are needed most. Understanding these patterns, and acting on them before exposure, is what truly reduces winter risk at scale.
Learn more about how Samsara safeguards against winter weather risks, with Weather Intelligence.
Get the latest from Samsara
Subscribe nowRead more


– 7 min read
Scale coaching and driver communications with an intelligent in-cab experience

Staff Product Marketing Manager

New AI-powered Weather Intelligence enhancements to improve safety for any season

Senior Product Marketing Manager

Samsara Coach for Safety and New AI tools for high-impact manager coaching

Principal Product Manager


Introducing Samsara Coach: AI-powered driver coaching at scale
Staff Product Marketing Manager

Resources for flood response efforts in California

EVP, Chief Marketing Officer